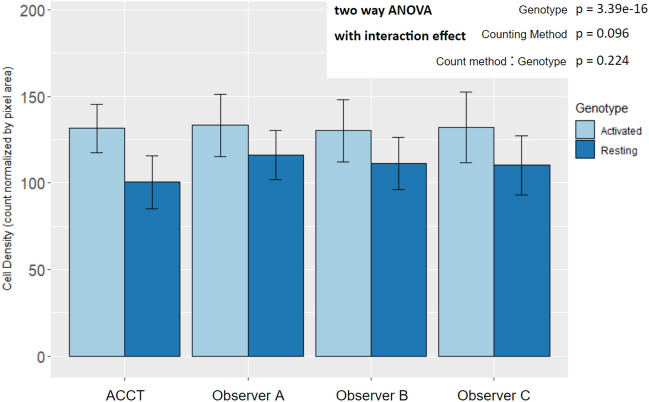
Figure 6.
Mean microglia density by experimental genotype in manual and automated counts. All counting methods found an increase in microglia density in Activated microglia images by two way ANOVA with interaction effect and Tukey HSD post-hoc analysis. The difference between counting method and the interaction effect did not display statistical significance. (Genotype: p = ; Counting Method: p = 0.096; Genotype:Counting Method: p = 0.224; Resting n = 22, Activated n = 20). There were not significant differences between the automatic count and Observer B and C. However, the ACCT count density trended lower overall than Observer A’s (p = 0.0599; Resting n = 22, Activated n = 20). This suggests that classifier 10 may have excluded some faintly stained or not well-in-focus cells in the Resting group images that Observer A did count. Error bars represent standard deviation.

