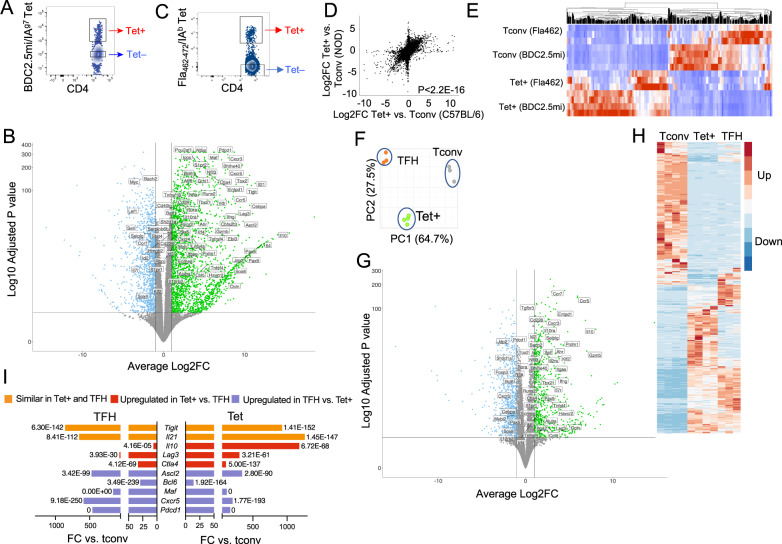
Fig. 1.
Transcriptional profiling of pMHCII-NP-induced TR1-like vs. Tconv and TFH CD4+ T cells. A Representative flow cytometric tetramer staining profiles of splenocytes from BDC2.5 mi/IAg7-NP-treated NOD mice. B Volcano plot showing gene expression differences between BDC2.5 mi/IAg7 Tet+ and Tet− cells from NOD mice treated with BDC2.5 mi/IAg7-NPs. The X-axis shows the log2-fold change values, and the Y-axis shows the −log10 adjusted P values. The thresholds for significance were |log2FC | >1 and adjusted P value < 0.05. Green, genes significantly upregulated; blue, genes significantly downregulated. Genes among the 106 selected genes from Supplementary Table 1 are labeled. C Representative flow cytometric tetramer staining profile of Fla462-472/IAb-NP-induced TR1-like cells in C57BL/6 mice exposed to 2–3% dextran sodium sulfate (DSS) in the drinking water (to induce colitis). D Correlations between gene expression levels (log2FC values) in BDC2.5 mi/IAg7-NP- and Fla462-472/IAb-NP-induced TR1-like cells (from NOD and C57BL/6 mice, respectively) compared to their Tet– counterparts. The data correspond to 3–4 Tet− and Tet+ samples per specificity from 2 experiments. E Heatmap comparing Tet+ and Tet− cells from BDC2.5 mi/IAg7-NP-treated NOD and Fla462-472/IAb-NP-treated B6 mice, showing similar RNAseq profiles for both subsets of cells in both genetic backgrounds. F Principal component analysis (PCA) plot for 3 TFH (orange), 3 Tconv (gray) and 4 BDC2.5 mi/IAg7-NP-induced Tet+(green) samples from 2 experiments. G Volcano plot showing gene expression differences between BDC2.5 mi/IAg7 Tet+ cells from NOD mice treated with BDC2.5 mi/IAg7-NPs and KLH-DNP-induced TFH cells in immunized NOD mice. The X-axis shows the log2FC values, and the Y-axis shows the −log10 adjusted P values. The thresholds for significance were |log2FC | >1 and adjusted P value < 0.05. Green, genes significantly upregulated; blue, genes significantly downregulated. Genes among the 106 selected genes from Supplementary Table 1 are labeled. H Heatmap comparing the expression of the 956 genes that were differentially expressed between BDC2.5 mi/IAg7 Tet+ and Tconv cells among BDC2.5 mi/IAg7 Tet+ cells, KLH-induced TFH cells and Tconv cells. The thresholds for significance were |FC | ≥ 4 and FDR ≤ 0.01. I Expression fold changes and adjusted P values for representative TFH/TR1-related genes in Tet+ T cells and TFH cells vs. Tconv cells (x-axis: fold change; labels: adjusted P values). Tigit and Il21 were expressed at similar levels in Tet+ and TFH cells; Il10, Lag3 and Ctla4 were upregulated in the Tet+ T-cell subset vs. its TFH counterpart; and Ascl2, Bcl6, Maf, Cxcr5, and Pdcd1 were upregulated in TFH vs. Tet+ cells. The P value in (D) was calculated via Pearson correlation analysis. The P values in I correspond to the FDR values calculated using the DESeq2 tool

