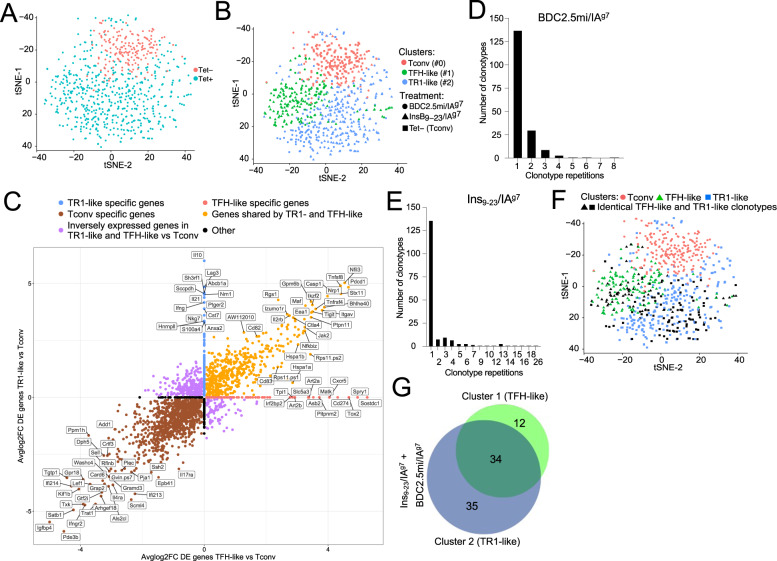
Fig. 2.
pMHCII-NP-induced TR1-like cells are transcriptionally homogeneous but oligoclonal and coexist with a Tet+ TFH-like subpopulation that contains identical clonotypes. A t-SNE plot of Smartseq2-based scRNAseq data for sorted Tet+ and Tet− cells from NOD mice treated with BDC2.5 mi or InsB9-23/IAg7-NPs (from n = 5 mice for Tet+ cells and 15 mice for Tet−cells; aliquots of the sorted cells were also used for other experiments). The data are from 4 experiments. B Seurat clustering analysis of the Tet+ pools from A showed the presence of two clusters for each pMHCII type. C Two-dimensional plot of the average log2FC values for the differentially expressed genes (adjusted P value < 0.05) between pMHCII-NP-induced Tet+ TR1-like, Tet+ TFH-like and Tet− cell types pooled from samples from BDC2.5/IAg7-NP-treated NOD mice (n = 5 mice for Tet+ cells and 15 mice for Tet− cells) and samples from Fla462-472/IAb-NP-treated C57BL/6 mice (n = 6 mice for Tet+ cells and 5 mice for Tet− cells). The data were obtained by SmartSeq2 scRNAseq in 2 experiments. The X-axis shows Tet+ TFH-like vs. Tconv cells, and the Y-axis shows Tet+ TR1-like vs. Tconv cells. The dot color represents the cell subset specificity of differential gene expression. Only the genes with the greatest differential expression are labeled. D, E Distribution of unique TCR sequences in cells in the Tet+ pools arising in response to treatment with two different pMHCII-NP types (BDC2.5mi- or InsB9-23/IAg7-NPs) in NOD mice. The histogram shows the distribution of the different TCRαβ clonotypes identified vs. the number of cells (clones) expressing each TCRαβ pair. The data are from 1 (D) and 3 (E) experiments. F tSNE plot from (B) showing the cluster locations for cells with TCRαβ pairs expressed by more than one cell (in black). The data correspond to BDC2.5mi- or InsB9-23/IAg7-NP-treated mice from 4 experiments. G Venn diagram from F showing the distribution of repeated TCRαβ pairs in clusters #1 (TFH-like) vs. #2 (TR1-like). Most (34/46) of the clonotypes found in the TFH-like cluster (#1) were also found in the TR1-like cluster (#2) (34/69)

