Fig. 3.
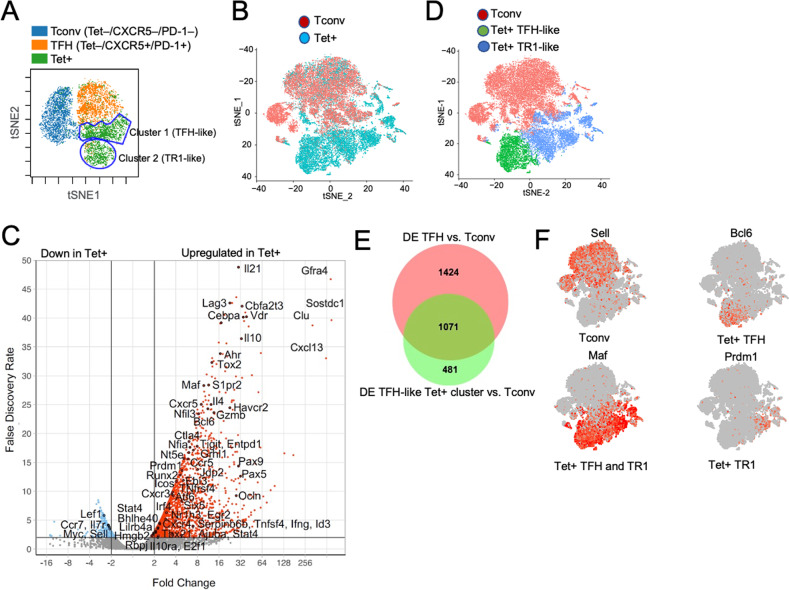
Identification of the tetramer+ TFH-like and TR1-like subclusters via mass cytometry and 10x Genomics scRNAseq. A tSNE plot for Tet−CXCR5−PD-1− (Tconv), Tet−PD-1hiCXCR5hi (TFH) and BDC2.5 mi/IAg7 Tet+ splenic CD4+ T cells stained with the 32-marker CyTOF panel listed in Supplementary Table 4. The data correspond to n = 4 samples each from 2 experiments. B t-SNE plot of 10x Genomics-based scRNAseq data for sorted Tet+ and Tet– cells from NOD mice treated with BDC2.5 mi or InsB9-23/IAg7-NPs (from n = 5 mice for Tet+ cells and 15 mice for Tet− cells; aliquots of the sorted cells were also used for other experiments). The data are from 4 experiments. C Volcano plots showing the Tet+ vs. Tconv comparison (from C), with representative TR1-associated and non-TR1-associated genes identified. Red, upregulated genes; blue, downregulated genes. D K-means clustering of the cells from (B). E Venn diagram comparing differentially expressed genes between bulk TFH and Tconv cells from KLH-immunized mice and between Tet+ TFH-like and Tet– Tconv cells from pMHCII-NP-treated mice. F Representative feature plots for genes enriched in the Tconv, Tet+ TFH and Tet+ TR1 subclusters or shared between the latter two. The P values in (B) were calculated by the Mann‒Whitney U test

