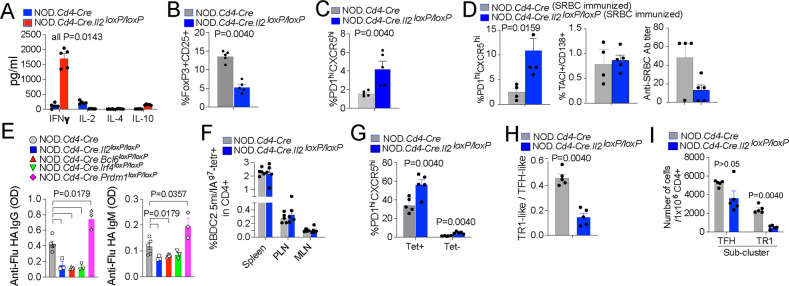
Fig. 4.
TFH and TR1 cell formation capacity in mice harboring IL-2-deficient T cells. A Cytokine secretion profiles of splenic CD4+ T cells from NOD.Cd4-Cre and NOD.Cd4-Cre.Il2loxP/loxP mice upon stimulation with anti-CD3/anti-CD28 mAb-coated beads. The data correspond to 4–5 mice/strain from 2 experiments. B Reduction in the frequency of peripheral CD25+FOXP3+ CD4+ T cells in NOD.Cd4-Cre.Il2loxP/loxP vs. NOD.Cd4-Cre mice. The data correspond to n = 5 mice/strain from 3 experiments. C NOD.Cd4-Cre.Il2loxP/loxP mice had increased percentages of endogenous PD-1hiCXCR5hi cells in the spleen compared to NOD.Cd4-Cre mice. The data correspond to n = 5 mice/strain from 3 experiments. D Percentages of splenic PD-1hiCXCR5hi (TFH) and TACI+CD138+ (plasma) cells and anti-SRBC antibody titers in NOD.Cd4-Cre.Il2loxP/loxP vs. NOD.Cd4-Cre mice upon SRBC immunization. The data correspond to n = 5 and 4 mice, respectively, from 2 experiments. E Anti-influenza virus IgG and IgM antibody titers (OD value) in 8–11-week-old male mice infected i.p. with 107 EID50 of the HKX31 (H3N2) strain twice at a 14-day interval. Fourteen days after the last infection, sera were collected and analyzed for the presence of H3N2-hemagglutinin (HA)-specific IgG and IgM via ELISA. The data correspond to n = 5, 3, 4, 3 and 3 mice from left to right. The data correspond to one experiment. F Average percentages of BDC2.5 mi/IAg7 Tet+ CD4+ T cells in various lymphoid organs of BDC2.5 mi/IAg7-NP-treated NOD.Cd4-Cre.Il2loxP/loxP vs. NOD.Cd4-Cre mice. The data correspond to 5 mice/strain from 3 experiments. G Average percentages of PD-1hiCXCR5hi (TFH) cells within the Tet+ and Tet– subsets of the mice in (F). H Cluster 2 (TR1):cluster 1 (TFH) ratios in the Tet+ subsets of BDC2.5 mi/IAg7-NP-treated NOD.Cd4-Cre and NOD.Cd4-Cre.Il2loxP/loxP mice, as measured via CyTOF. I Absolute numbers of cluster 1 (TFH) and cluster 2 (TR1) cells in the Tet+ subsets of BDC2.5 mi/IAg7-NP-treated NOD.Cd4-Cre and NOD.Cd4-Cre.Il2loxP/loxP mice, as measured via CyTOF. The data correspond to 5 mice/strain from 3 experiments. The data in all panels correspond to the mean ± SEM values. P values were calculated by the Mann‒Whitney U test

