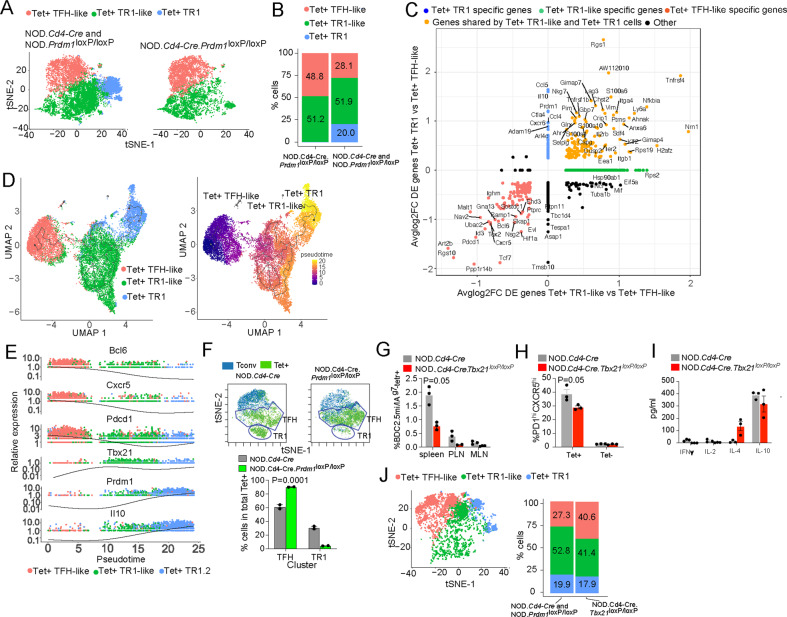
Fig. 6.
BLIMP1-dependent TFH-to-TR1 cell reprogramming. A tSNE plots of 10x Genomics scRNAseq data for sorted BDC2.5 mi/IAg7 tetramer+ (Tet+) cells from BDC2.5 mi/IAg7-NP-treated NOD.Cd4-Cre (n = 3) and NOD.Prdm1loxP/loxP (n = 3) mice vs. NOD.Cd4-Cre.Prdm1loxP/loxP (n = 2) mice from 1 experiment. Cell subsets were identified via k-means clustering and prediction using the 10x Genomics scRNAseq data from Fig. 3C as a reference. B Fraction of total cells corresponding to each Tet+ subcluster. C Two-dimensional plot of the average log2FC values for the differentially expressed genes in the terminally differentiated TR1 vs. TFH (y-axis) vs. TR1-like vs. TFH (x-axis) comparisons in Prdm1-competent mice. D Trajectory analysis results on UMAP plots generated with 10x Genomics scRNAseq data from BDC2.5 mi/IAg7 tetramer (Tet+) cells isolated from BDC2.5 mi/IAg7-NP-treated NOD.Cd4-Cre and NOD.Prdm1loxP/loxP mice. Left, cell cluster identity; right, pseudotime analysis. E Relative expression levels of representative TFH- and TR1-specific genes vs. pseudotime. F Top, tSNE plot for Tet–CXCR5–PD-1− (Tconv) and BDC2.5 mi/IAg7 Tet+ splenic CD4+ T cells (Tet+) from BDC2.5 mi/IAg7-NP-treated NOD.Cd4-Cre and NOD.Prdm1loxP/loxP mice stained with the 32-marker CyTOF panel listed in Supplementary Table 4. Bottom, average % of cells ±S.E.M. values in clusters #1 and #2. The data correspond to 2 mice/strain from 1 experiment. G Percentages of BDC2.5 mi/IAg7 Tet+ CD4+ T cells in various lymphoid organs from BDC2.5 mi/IAg7-NP-treated NOD.Cd4-Cre.Tbx21loxP/loxP vs. NOD.Cd4-Cre mice. The data correspond to 3 mice/strain from 3 experiments. H Average percentages of PD-1hiCXCR5hi (TFH) cells within the Tet+ and Tet– subsets of the mice in (G). I Cytokine secretion profiles of splenic Tet+ CD4+ T cells from the mice in (G) upon stimulation with anti-CD3/anti-CD28 mAb-coated beads. J Left: tSNE plots of 10x Genomics scRNAseq data for sorted BDC2.5 mi/IAg7 tetramer (Tet+) cells from BDC2.5 mi/IAg7-NP-treated NOD.Cd4-Cre.Tbx21loxP/loxP mice (n = 3) from 1 experiment. Right: Fraction of total cells corresponding to each Tet+ subcluster in BDC2.5 mi/IAg7-NP-treated NOD.Cd4-Cre.Tbx21loxP/loxP vs. control (NOD.Cd4-Cre and NOD.Prdm1loxP/loxP) mice. The data in (G–I) correspond to the mean ± SEM values. The P values in (F) and (G–I) were calculated via two-way ANOVA and the Mann‒Whitney U test, respectively

