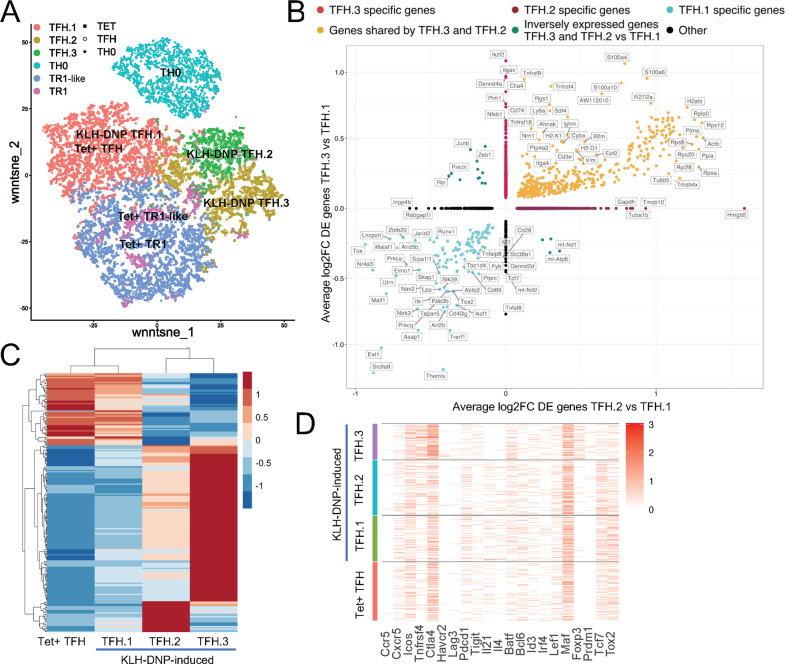
Fig. 8.
Single-cell multiomic analysis of pMHCII-NP-induced TFH-TR1 cells vs. KLH-induced TFH cells. A tSNE plot of weighted nearest neighbor-integrated scRNAseq and scATACseq data from BDC2.5 mi/IAg7 Tet+, KLH-induced TFH and TH0 cells. The colors represent the different K-means and their predicted identity. BDC2.5 mi/IAg7 Tet+ subclustered into TFH, TR1-like and TR1 cells, while KLH-induced cells subclustered into TFH.1, TFH.2 and TFH.3 cells. BDC2.5 mi/IAg7 Tet+ TFH and KLH-induced TFH.1 cells clustered together. The data are from 4 (BDC2.5 mi/IAg7 Tet+) and 8 mice (KLH-induced TFH and TH0) from 2 experiments. B Two-dimensional plot of the average log2FC values for the differentially expressed genes (adjusted P value <0.05) among KLH-DNP-induced TFH cell subtypes (TFH.1, TFH.2 and TFH.3) from (A). The data were obtained from 10X Genomics scRNAseq for CD4+CD44hiPD-1hiCXCR5hi T cells sorted from KLH-DNP-immunized NOD mice (n = 5). The X-axis shows the TFH.2 vs. TFH.1 comparison; the Y-axis, the TFH.3 vs. TFH.1 comparison. The dot color represents the subset specificity of differential gene expression. C Heatmap and dendrogram showing the average relative gene expression levels in BDC2.5 mi/IAg7 Tet+ TFH cells and the three clusters within the KLH-induced TFH cell pool (TFH.1, TFH.2 and TFH.3). D Single-cell resolution heatmap showing the relative expression levels of TFH-related genes in BDC2.5 mi/IAg7 Tet+ TFH cells and the three clusters within the KLH-induced TFH pool (TFH.1, TFH.2 and TFH.3)

