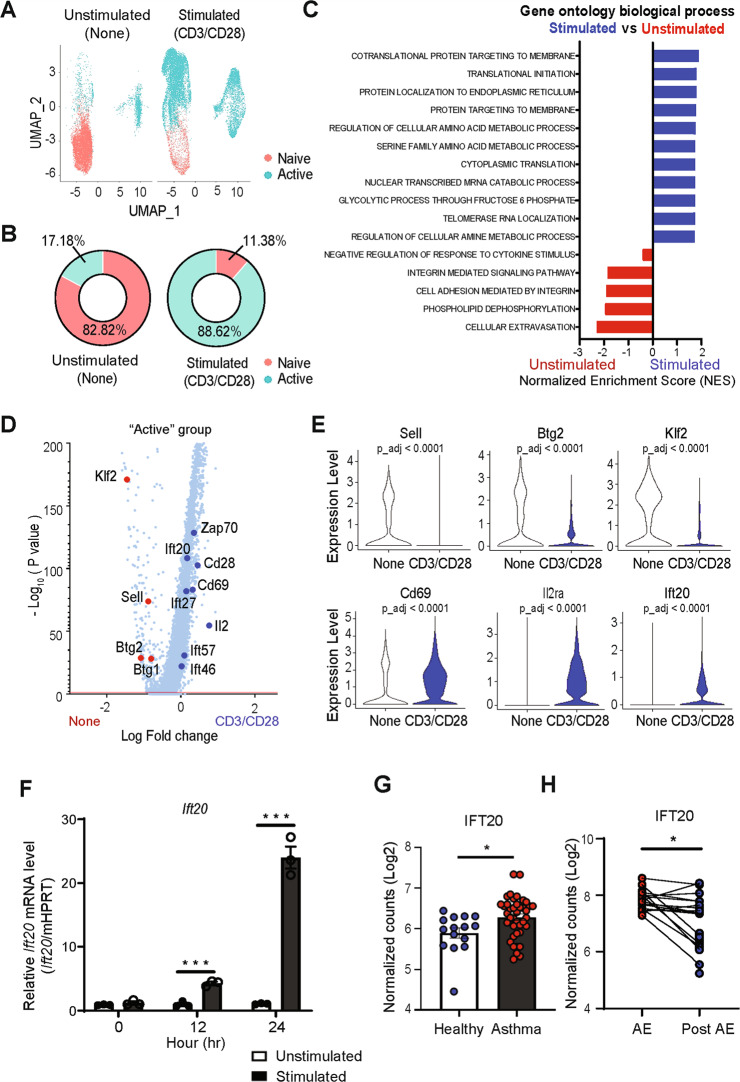
Fig. 1. IFT20 is important for CD4+ T cell activation.
A–E Analysis of single-cell RNA sequencing (scRNA-seq) data from CD4+ T cells either left unstimulated or stimulated with anti-CD3 and anti-CD28 antibodies. A Uniform manifold approximation and projection (UMAP) of unstimulated CD4+ T cells (none, 8,253 cells) and CD3/CD28-stimulated CD4+ T cells (CD3/CD28, 10,320 cells). The clusters were arranged into “naïve” and “active” groups based on the expression of Sell and Cd69. B Doughnut graphs depicting the percentages of cells in the “naïve” and “active” groups in unstimulated (none) and CD3/CD28-stimulated CD4+ T cells (CD3/CD28). C Gene set enrichment analysis (GSEA) using Gene Ontology biological process gene sets. The statistically significant gene set (FDR < 0.25) was sorted in order of the normalized enrichment score (NES). D Volcano plot showing differentially expressed genes (DEGs) in unstimulated (none) vs. CD3/CD28-stimulated CD4+ T cells (CD3/CD28). Each dot represents an individual gene. Significant DEGs in the none and CD3/CD28 groups are colored red and blue, respectively. E Violin plots for genes showing significant differential expression in the volcano plot. F Time course of Ift20 expression in response to CD4+ T cell activation. The levels of Ift20 mRNA were measured by quantitative reverse transcription (qRT)-PCR in CD4+ T cells activated for 0, 12, and 24 h. Naïve CD4+ T cells enriched by magnetic beads were activated with 1 μg/mL anti-CD3 and 1 μg/mL anti-CD28 antibodies. G IFT20 expression in an RNA-seq dataset derived from Th2-enriched CD4+ T cells isolated from the peripheral blood of healthy subjects and asthma patients (Gene Expression Omnibus [GEO] accession number GSE75011). H IFT20 expression in a microarray dataset derived from nasal lavage cells from asthma patients with acute exacerbation (AE) and in a postexacerbation state (Post-AE) (GEO accession number, GSE30326). The data are shown as the mean ± standard error or the mean (SEM). Statistical significance was calculated using the unpaired Student’s t test (F, G) or paired Student’s t test (H). *P < 0.05, ***P < 0.001

