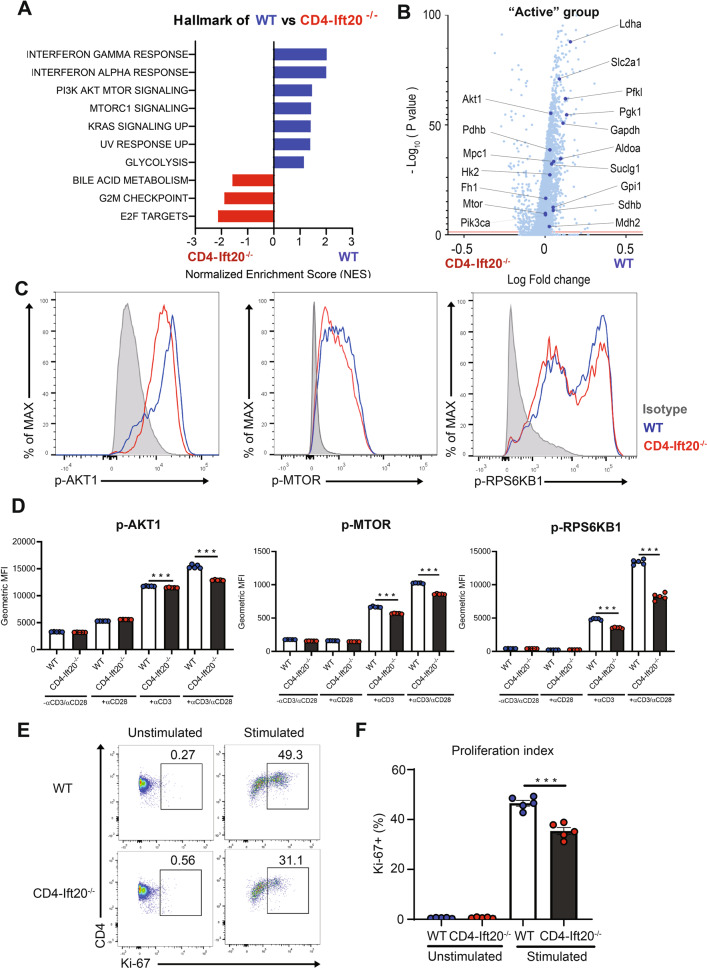
Fig. 5. IFT20 enhances AKT–mTOR signaling and CD4+ T cell proliferation.
A, B Naïve CD4+ T cells from WT and IFT20-KO mice were activated with anti-CD3 and anti-CD28 antibodies for 24 h and analyzed by scRNA-seq. A GSEA using hallmark gene sets. The statistically significant gene set (FDR < 0.25) was sorted in order of the normalized enrichment score (NES). B Volcano plot showing DEGs in CD4+ T cells from WT and IFT20-KO mice. Each dot represents an individual gene. Significant DEGs in the WT group are colored blue. C–F Naïve CD4+ T cells from IFT20-KO and WT mice were enriched by magnetic beads and activated with 1 μg/mL anti-CD3 and 1 μg/mL anti-CD28 antibodies for 2 days. C The levels of phosphorylated AKT1 (p-AKT1), mTOR (p-mTOR), and RPS6KB1 (p-RPS6KB1) were assessed by flow cytometry using phospho-specific antibodies. D Bar graphs indicating the mean fluorescence intensity (MFI) of p-AKT1, p-MTOR, and p-RPS6KB1 expression in IFT20-KO and WT cells. E Ki-67 staining frequencies were examined by flow cytometry. F Bar graphs indicating the frequencies of Ki-67 staining. The data are shown as the mean ± SEM. Statistical significance was calculated by unpaired Student’s t test. ***P < 0.001

