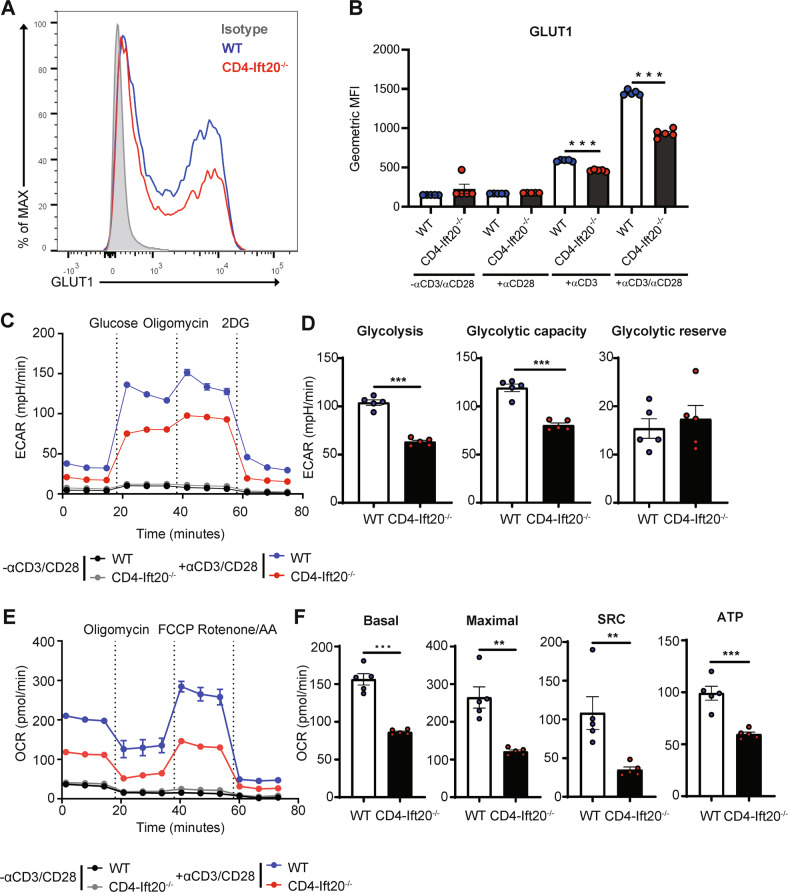
Fig. 6. IFT20 regulates aerobic glycolysis and cellular respiration in CD4+ T cells.
A, B Naïve CD4+ T cells from IFT20-KO and WT mice enriched by magnetic beads were activated with 1 μg/mL anti-CD3 and 1 μg/mL anti-CD28 antibodies for 24 h. A The levels of GLUT1 were examined by flow cytometry. Representative MFI values of GLUT1 expression in IFT20-KO and WT cells are shown. B Bar graphs indicating the MFIs of GLUT1 levels are shown. C–F Naïve CD4+ T cells from IFT20-KO and WT mice enriched by magnetic beads were activated with 1 μg/mL anti-CD3 and 1 μg/mL anti-CD28 antibodies for 48 h. C Extracellular acidification rate (ECAR) in CD4+ T cells from WT (n = 5) and IFT20-KO (n = 5) either left unstimulated or stimulated with 1 μg/mL anti-CD3 and 1 μg/mL anti-CD28 antibodies for 48 h (n = 5) was measured by the glycolysis stress test. D Glycolysis, glycolytic capacity and glycolytic reserve of CD4+ T cells from WT and IFT20-KO mice activated as in (C) (n = 5). E The oxygen consumption rate (OCR) was measured by the mitochondrial stress test in unstimulated (n = 5) and stimulated (n = 5) CD4+ T cells from WT and IFT20-KO mice. F Basal respiration, maximal respiration, spare respiratory capacity, and ATP production of stimulated CD4+ T cells from WT and IFT20-KO mice (n = 5). SRC, Spare respiratory capacity; ATP, ATP production. The data are shown as the mean ± SEM. Statistical significance was calculated by unpaired Student’s t test. **P < 0.01, ***P < 0.001

