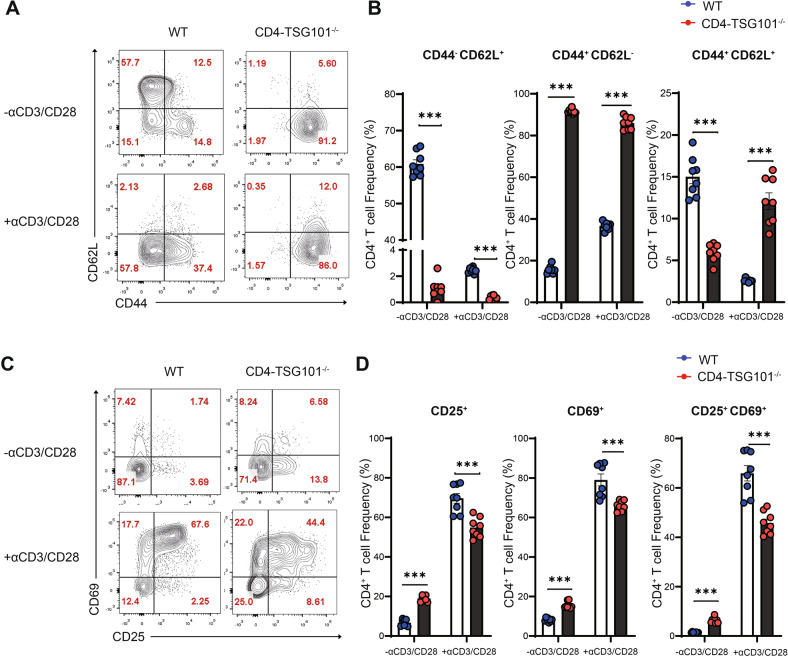
Fig. 7. TSG101 deficiency reduced CD4+ T cell activation.
A–D CD4+ T cells from the spleens of TSG101-KO and WT mice were enriched by magnetic beads and stimulated with 1 μg/mL anti-CD3 and 1 μg/mL anti-CD28 antibodies for 8 h. A Representative flow cytometry plots showing the expression of CD44 and CD62L in unstimulated and stimulated CD4+ T cells from WT and TSG101-KO mice. B The frequencies of CD44-CD62L+, CD44+CD62L-, and CD44+CD62L+ T cells were measured by flow cytometry (n = 8). C Representative flow cytometry plots showing the expression of CD25 and CD69 in unstimulated and stimulated CD4+ T cells from WT and IFT20-KO mice. D The frequencies of CD25+(CD25+CD69+ and CD25+CD69-), CD69+(CD25+CD69+ and CD25-CD69+), and CD25+CD69+ T cells were measured by flow cytometry (n = 8). In A–D, the data represent more than three independent experiments. CD4+ T cells were obtained by negative selection using a CD4+ T cell enrichment kit. The data are expressed as the mean ± SEM. Significance was calculated using an unpaired Student’s t test. ***P < 0.001

