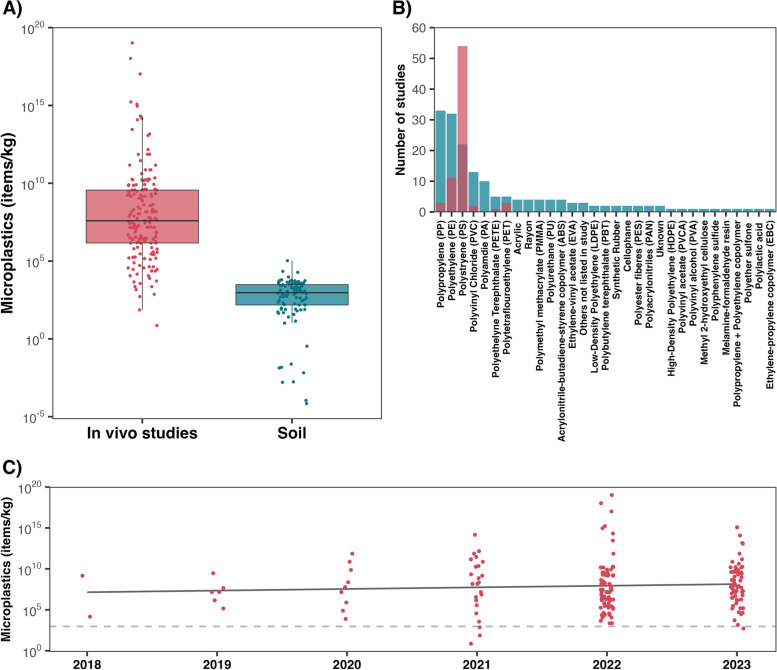
Fig. 1.
The boxplot in A shows the concentrations of microplastics fed to rodents in in vivo lab studies, compared to those of MPs found in soils. In B the number of soil studies which identified different plastic polymers are shown in blue, whereas the number of polymers assessed via in vivo health studies are shown in red. In C, the concentrations of microplastics being administered to rodents in in vivo studies is shown as a function of year of publication. The dashed line in C represents the median concentration of microplastics found in soils, while the solid line represents the trend of a fitted regression model. Data were compiled from 114 peer-reviewed studies; 41 on microplastics in soil and 73 on the health effects of microplastics

