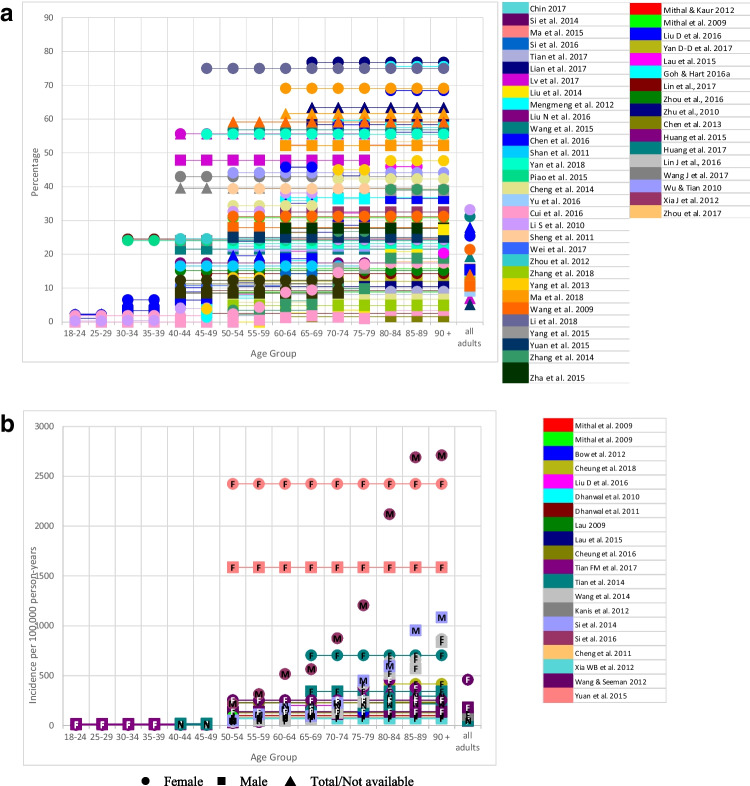
Fig. 3.
a China osteoporosis prevalence. b China fracture incidence. Connected lines represent “estimated” data reflecting findings for broad age ranges (e.g. 60–75, 50 +); these data were noted as linked data points for all age categories included in the reported range. Each color represents a single study. “All adults” represents generalized data describing broad populations without specified age groups (e.g. “Five percent of Australian men have osteoporosis”). Full citations for studies not cited in-text can be found in the Appendix. Circle = female; square = male; triangle = total/not available. F, femoral neck/hip; V, vertebrae/spine; W, wrist/forearm; H, humerus; M, multiple; O, other; N, not specified/general fragility fractures

