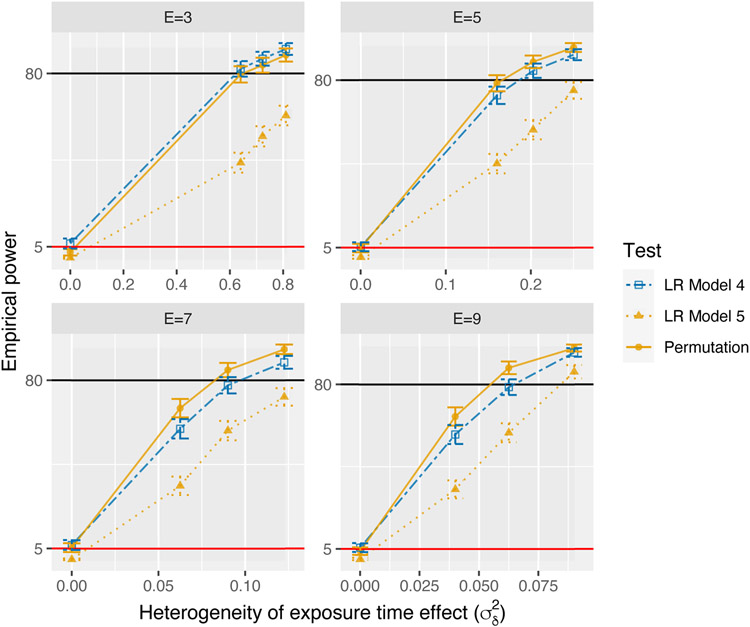
FIGURE 1.
Empirical power , with Monte Carlo error bars computed with upper and lower limits defined by , where z0.025 is the 0.025-tail probability of the standard normal distribution, as function of for varying number of exposure time points observed (E). The orange solid line with circles represents the proposed permutation test. The blue dot-dashed line with open squares represents the likelihood ratio (LR) test based on Model 4. The orange dotted line with triangles represents the LR test based on Model 5. The black horizontal line corresponds to 80%. The red horizontal line corresponds to 5%.

