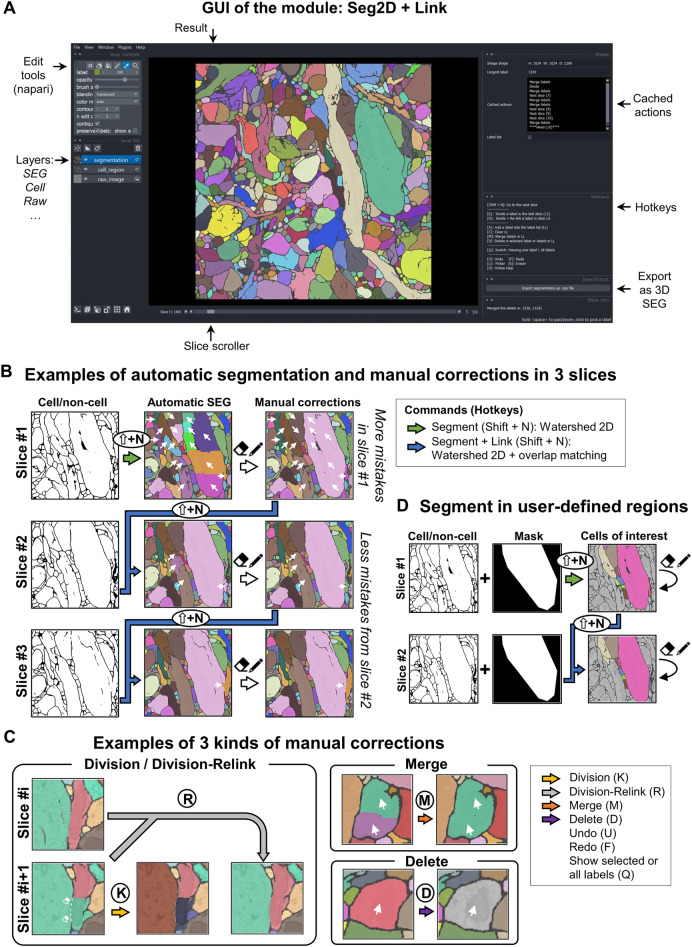
Figure 2.
Functions of the Seg2D + Link module. (A) The GUI of the main window. (B) The process of semi-automatic segmentation in slices #1, #2, and #3. Different colors indicate different cells. The arrows on the images indicate the regions with mistakes in the automatic segmentation and the results after manual corrections. (C) The manual correction functions. Arrows on the images indicate the regions to be corrected. (D) The masking function for segmentation in user-defined regions.

