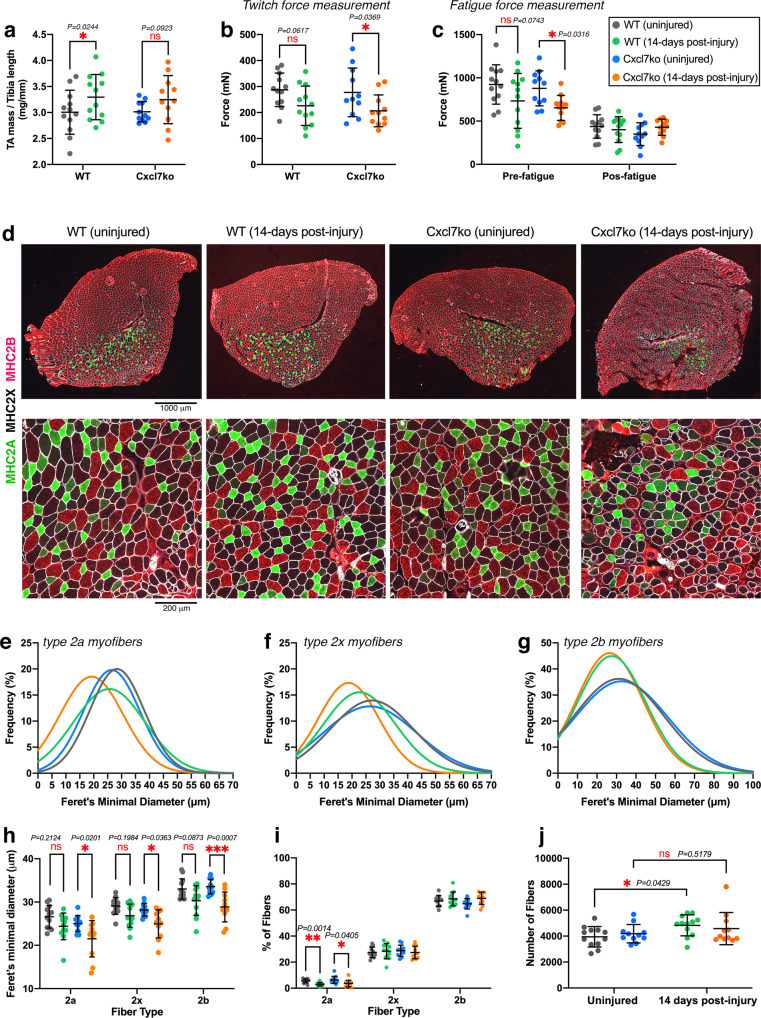
Fig. 6. Myofiber size and force production are reduced in post-injury muscles from Cxcl7ko mice.
Analysis of TA muscles after 14 days from glycerol-induced injury. a TA muscle weight normalized by the tibia bone length indicates that there is post-injury hypertrophy, although this is not significant for Cxcl7ko mice. b There is no significant difference in the twitch force of uninjured and post-injury muscles from WT mice, indicating that regeneration has recovered muscle function. However, post-injury muscles from Cxcl7ko mice are significantly weaker compared to uninjured muscles. c Similar deficits in muscle force are found in pre-fatigue muscles from Cxcl7ko mice, whereas there are no differences post-fatigue. In a–c, the graphs display the mean ±SD with n = 12 (WT) and n = 11 (Cxcl7ko) biologically independent samples from n = 12 and n = 11 independent mice, respectively; *P < 0.05 (two-way ANOVA with Tukey post hoc test), ns = not significant. d Immunostaining of uninjured and post-injury muscles from control and Cxcl7ko mice with antibodies for myosin heavy chain isoforms to detect type 2a myofibers (green), type 2x myofibers (black), and type 2b myofibers (red). Defects in regeneration (such as space in-between myofibers) are found in post-injury muscles from Cxcl7ko mice compared to post-injury controls. e–g Gaussian plots indicate an overall reduced size (Feret’s minimal diameter) of type 2a (e) and type 2x (f) myofibers in post-injury muscles from Cxcl7ko mice, compared to post-injury muscles from WT mice and uninjured controls. h Quantitation of myofiber sizes based on the average values obtained from the individual muscles in a group. There is a significant decline in the size of myofibers in post-injury muscles from Cxcl7ko mice whereas myofiber size differences between uninjured and post-injury WT muscles are not significant. i There is an overall similar myofiber type composition of uninjured and post-injury TA muscles. j Myofiber number similarly increases in post-injury versus uninjured muscles from WT and Cxcl7ko. In h–j, the graphs display the mean ±SD with n = 12 (WT) and n = 11 (Cxcl7ko) biologically independent samples from n = 12 and n = 11 independent mice, respectively; *P < 0.05, **P < 0.01, ***P < 0.001, ns = not significant (two-way ANOVA with Tukey post hoc test). Source data are provided in the Source data file.

