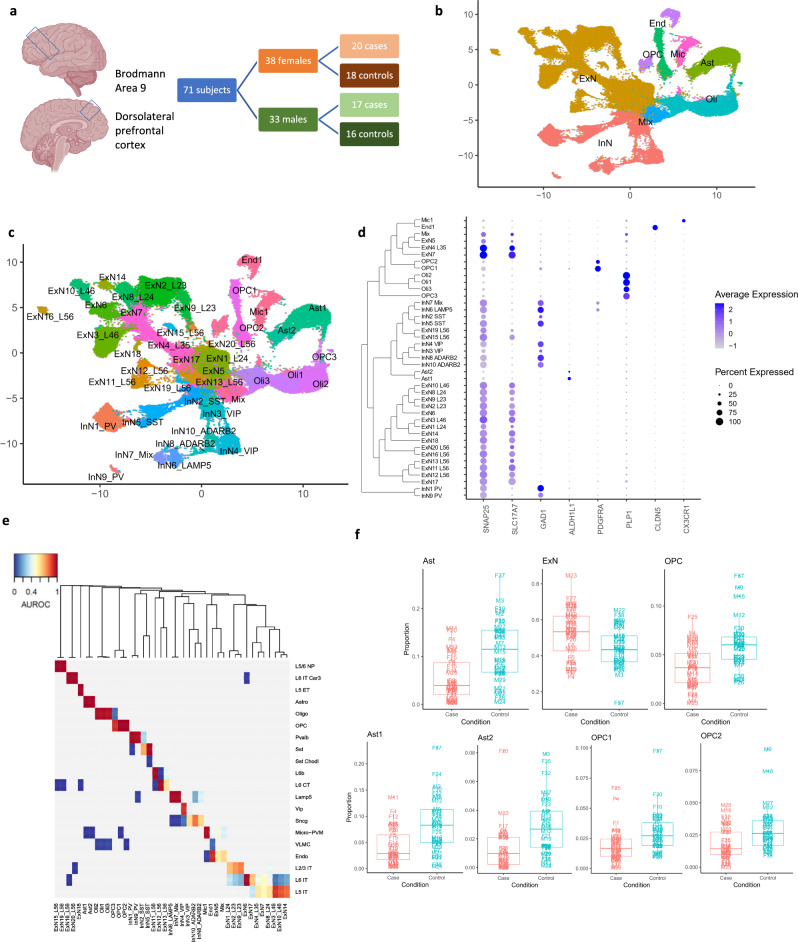
Fig. 1. Overview of cell types characterized in the dlPFC.
a Schematic of study design. Diagrams depict the brain region of interest, Brodmann area 9, corresponding to the dlPFC. b UMAP plot colored by the broad cell types. c UMAP plot colored by the individual clusters identified and annotated. For UMAP plots, the x and y-axes represent the first and second UMAP co-ordinates respectively. d DotPlot depicting the expression of marker genes (SNAP25 – neurons, SLC17A7 – excitatory neurons, GAD1 – inhibitory neurons, ALDH1L1 – astrocytes, PDGFRA – oligodendrocyte precursor cells, PLP1 – oligodendrocytes, CLDN5 – endothelial cells, CX3CR1 – microglia). The dendrogram next to the cluster names shows the relationship between the clusters by using the distance based on average expression of highly variable genes. e Best hits heatmap from MetaNeighbor showing the correspondence between the clusters in our dataset (columns) and the broad categories of cells identified in the Allen Brain Institute human motor cortex snRNA-seq dataset20 (rows). f Boxplots showing the proportion of nuclei in each cluster for each subject split by cases and controls for the broad OPC, astrocyte, and excitatory neuron cell types and the Ast1, Ast2, OPC1, and OPC2 clusters (n = 37 cases, 34 controls, representing biologically independent samples for each cluster or broad cell type). The middle line is the median. The lower and upper hinges correspond to the 25th and 75th percentiles. Upper and lower whiskers extend from the upper or lower hinges to the largest or smallest value no further than 1.5 times the inter-quartile range from the hinge, where the inter-quartile range is the distance between the first and third quartiles. Points beyond the end of the whiskers are plotted individually. In Fig. 1c–e, excitatory neuronal cluster names contain approximate layer annotations and inhibitory neuronal cluster names contain MGE or CGE specific marker information as a suffix where applicable, as described in methods: Cluster annotation. For example, ExN10_L46 denotes a cluster of excitatory neurons with enrichment of marker genes from layer 4 to layer 6 of the cortex and InN1_PV denotes a cluster on inhibitory neurons with enrichment of the MGE specific marker PV. This convention is used throughout the paper. Brain diagram in 1a was created with BioRender.com. Source data are provided as a Source Data file.

