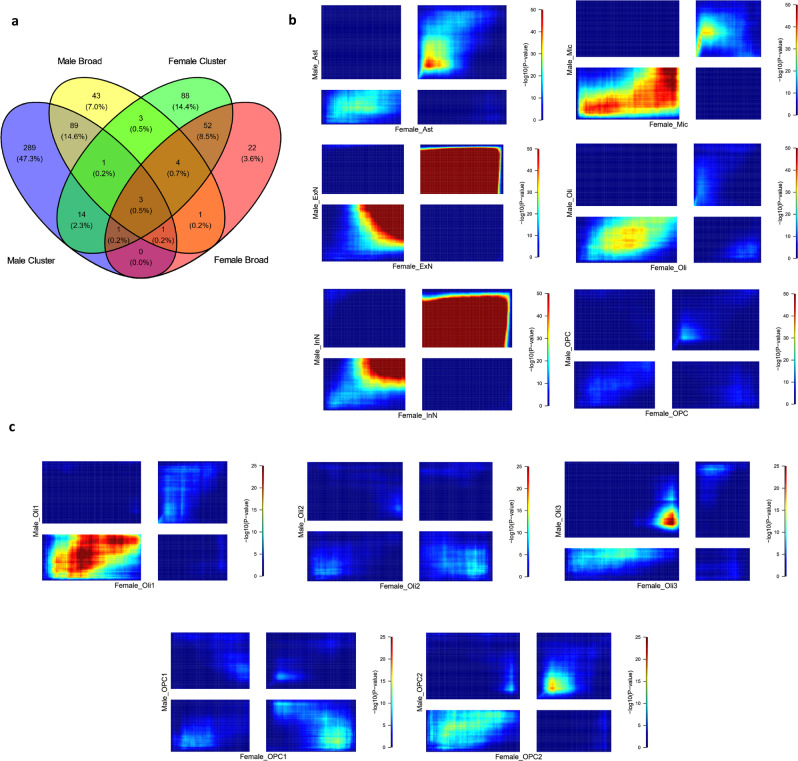
Fig. 2. Overall comparison of cell type specific MDD-associated gene expression changes in males and females.
a Venn diagram showing the overlap of DEGs between the male and female datasets at the broad cell type and cluster levels. b RRHO2 plots for correspondence between differential expression results for broad cell types in the female (x-axis) and male (y-axis) datasets. Warm colors in the bottom left and top right quadrants reflect overlap in genes with increased expression or decreased expression respectively, in cases versus controls between the male and female datasets. Warm colors in the top left and bottom right quadrants reflect overlaps in genes with the opposite direction of effects between the male and female datasets. For each dataset, genes were ranked according to the value of the log of the fold change multiplied by the negative base 10 logarithm of the uncorrected p-value from differential expression analysis. c RRHO2 plots similar to (b) but for oligodendrocyte lineage clusters. For RRHO2 plots comparing broad cell types the color scale maximum was set to a −log10(p-value) of 50, and for RRHO2 plots comparing clusters the color scale maximum was set to a −log10(p-value) of 25 for ease of comparison. RRHO2 uses one-sided hypergeometric tests, the p-values plotted here are uncorrected. Source data are provided as a Source Data file.

