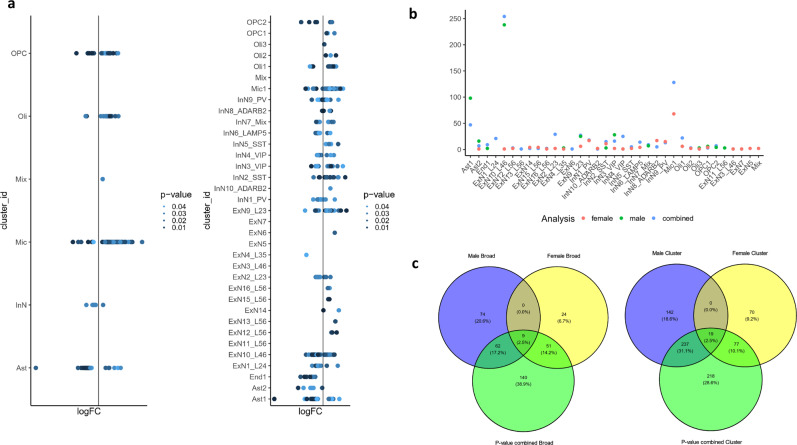
Fig. 4. p-value combination meta-analysis results.
a, b Distribution of DEGs across the (left) broad cell types and (right) clusters after p-value combination meta-analysis. b Numbers of DEGs (y-axis) in each cluster for the male analysis, female analysis, and meta-analysis. c, d Overlap of meta-analysis DEGs with the individual analyses of the male and female datasets for (c) broad cell types and (d) clusters. The statistical test performed is Fisher combination of p-values as implemented in metaRNAseq, the test is one-sided, and the p-values were Benjamini Hochberg corrected. Source data are provided as a Source Data file.

