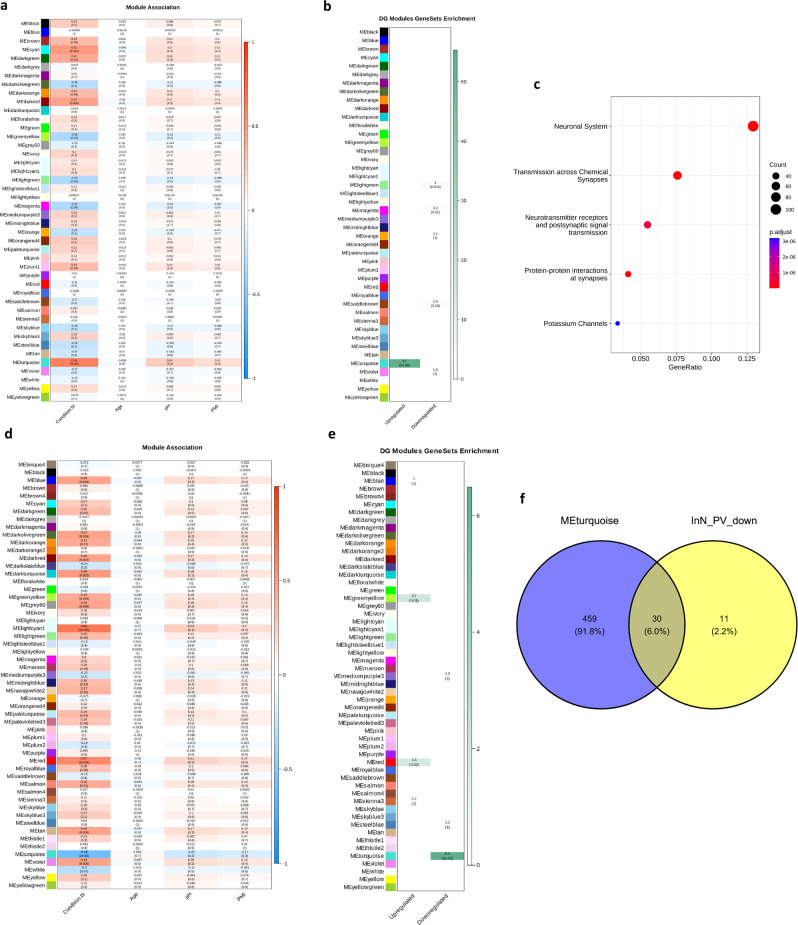
Fig. 6. WGCNA results for microglia and PV interneurons in females.
a Heatmap showing the correlation and associated p-value, in parentheses, of Mic1 WGCNA module eigengenes with case-control status and covariates (age, pH, PMI). b Heatmap showing the test-statistic and FDR corrected p-value, in parentheses, for one-sided Fisher tests of overlap between the Mic1 WGCNA module member genes and DEGs in females in Mic1. c Top Reactome pathway gene sets over-represented in Mic1 WGCNA, in the MEturqouise module using one-tailed hypergeometric testing. Uncorrected p-values are plotted. d Heatmap showing the correlation and associated p-value, in parentheses, of InN_PV WGCNA module eigengenes with case-control status and covariates. e Heatmap showing the test-statistic and FDR corrected p-value, in parentheses, for one-sided Fisher tests of overlap between the InN_PV WGCNA module member genes and DEGs in females the InN1_PV or InN9_PV clusters. f Venn diagram showing the overlap of Reactome pathway gene sets enriched in the InN_PV WGCNA module MEturquoise (associated negatively with case status) and downregulated via GSEA in cases within InN1_PV or InN9_PV. For 6a, 6d the statistical test performed was a Pearson correlation as implemented in the WGCNA package and p-values are one-sided and uncorrected. Source data are provided as a Source Data file.

