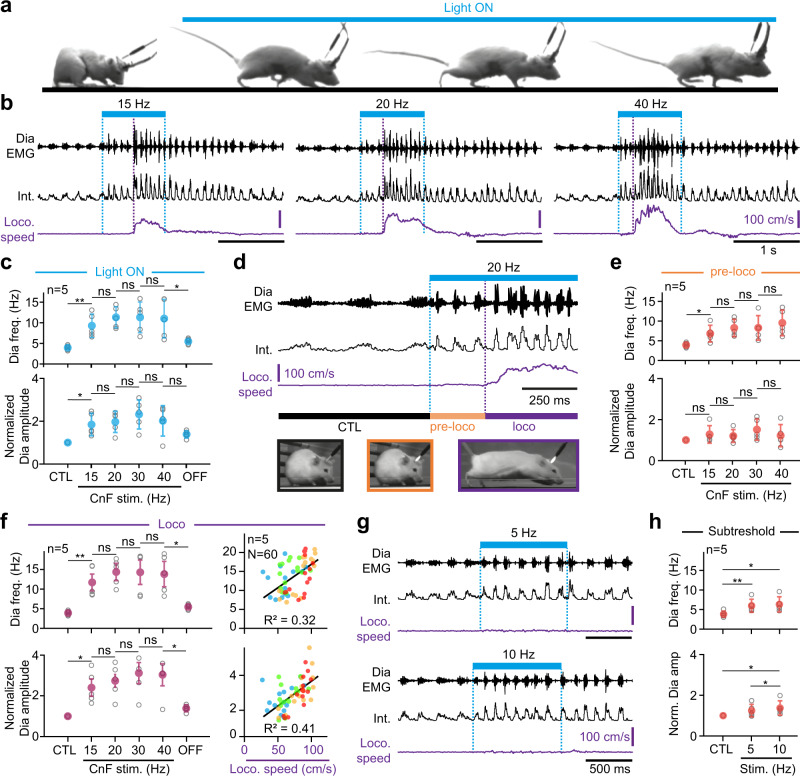
Fig. 3. Glutamatergic CnF neurons upregulate breathing in synergy with, and even in the absence of, locomotion.
a Four representative video snapshots taken before and during the photostimulation of Glut+ CnF neurons for 1 s, which triggers running. The experimental strategy is similar to Fig. 2a. b Raw (DiaEMG) and integrated (Int.) diaphragmatic electromyogram and locomotor speed during photostimulations. c Diaphragmatic frequency and amplitude at rest (CTL), during CnF photostimulation at increasing frequencies, and following light offset (OFF). Amplitudes are normalized to CTL. From left to right: frequency, p = 0,007; p = 0,1046; p = 0,9782; p = 0,7305; p = 0,0392; amplitude, p = 0,0229; p = 0,4756; p = 0,074; p = 0,2066; p = 0,0739. d Enlarged EMG recording showing the “pre-loco” and the “loco” phases. e Diaphragmatic frequency and amplitude in CTL and during the “pre-loco” phase at increasing CnF photostimulation frequencies. From left to right: frequency, p = 0,0156; p = 0,1128; p = 0,9795; p = 0,1639; amplitude, p = 0,3377; p = 0,108; p = 0,3298; p = 0,5486. f Left: similar quantifications during the “loco” phase. From left to right: frequency, p = 0,0067; p = 0,1021; p = 0,9477; p = 0,6789; amplitude, p = 0,0156; p = 0,2892; p = 0,0747; p = 0,6608. Right: diaphragm frequency and amplitude in relation to locomotor speed. Note that 32% of frequency and 41% of amplitude correlate with locomotor speed (R2). CnF photostimulation frequencies are also indicated by the colored circles (blue: 15 Hz, green: 20 Hz, orange: 30 Hz, Red: 40 Hz). g Representative EMG recordings during subthreshold CnF photostimulations that do not initiate running but upregulate breathing frequency and amplitude. h Quantifications of diaphragm frequency and amplitude in CTL and during subthreshold CnF stimulations. Frequency: CTL vs 5 Hz, p = 0,00895; 5 Hz vs 10 Hz, p = 0,0618; CTL vs 10 Hz, p = 0,0109. Amplitude: CTL vs 5 Hz, p = 0,148; 5 Hz vs 10 Hz, p = 0,047; CTL vs 10 Hz, p = 0,0746. In graphs, gray circles are means of 3 trials per animal, colored circles are means ± SD across n mice, * denotes p < 0,05, ** denotes p < 0,01, and ns denotes p < 0,05. All tests are matched-pairs t tests. For all graphs, source data are provided as a Source data file. See also Figs. S1, S4, S5, S6, and S7.

