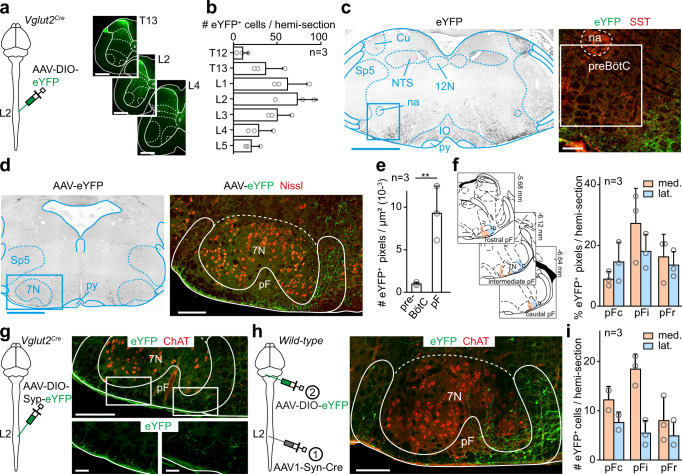
Fig. 4. Glutamatergic lumbar spinal cord neurons contact the pF respiratory area.
a Left: experimental strategy for labeling projections of Glut+ thoraco-lumbar neurons bilaterally. Right: transverse sections showing transfected spinal neurons. Scale bars, 500 µm. b Distribution of eYFP+ transfected cells in different thoraco-lumbar segments. Bar-graphs are the mean number ± SD per hemi-section, and gray circles are mean values of n individual mice. c Left: transverse section at the preBötC level showing eYFP+ spinal projections. Scale bar, 1 mm. Right: magnification of the preBötC area containing SST+ cells. Note the absence of spinal projections. Scale bar, 100 µm. Representative of n = 3 mice. d Transverse section at the level of the pF showing eYFP+ spinal projections. Scale bar, 1 mm. Right: magnification showing abundant eYFP+ spinal projections in the pF area, ventrally and ventro-medially to the 7 N motoneurons. e Mean density ± SD across n mice of eYFP+ fluorescent pixels in preBötC and pF hemi-sections. Gray circles are the mean values of individual mice. ** denotes p = 0.0039 (Wilcoxon matched-pairs tests; 9 sections per area). f Left: delineation of rostro-caudal (top to bottom) and medio-lateral (orange and blue) subdivisions of the pF. Right: distribution of fluorescent pixels in the pF subdivisions. Bars are means ± SD across n mice and gray circles are mean values of individual mice. g Left: experimental strategy for labeling synaptic boutons of Glut+ thoraco-lumbar neurons. Injections were done bilaterally. Right: transverse section showing putative synaptic boutons in the pF area. Scale bars, 250 (top) and 50 (bottom) µm. Representative of n = 3 mice. h Left: experimental strategy for labeling pF neurons contacted by spinal neurons through anterograde transsynaptic transfer of an AAV1-Syn-Cre in adult wild-type mice. Injections were done bilaterally. Right: transverse section showing eYFP+ neurons in the pF area demonstrating that spinal ascending projections make synaptic contacts with pF neurons. Representative of n = 3 mice. Scale bar, 200 µm. i Quantification of transsynaptically labeled neurons in the pF subdivisions defined in f. See “Methods” for details. For all graphs, source data are provided as a Source data file. See also Fig. S8.

