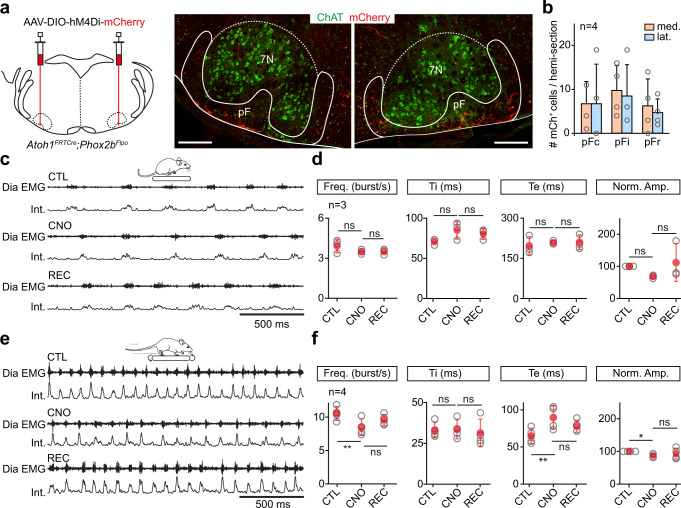
Fig. 6. Silencing RTNPhox2b/Atoh1 neurons reduces respiratory frequency during running.
a Left: experimental strategy for silencing RTNPhox2b/Atoh1 neurons bilaterally using the virally-driven inhibitory DREADD receptor hM4Di in Atoh1FRTCre;Phox2bFlpo adult mice. Right: transverse sections showing bilaterally transfected neurons in the pF area around the 7N motoneurons identified by Choline Acetyl Transferase (ChAT) expression. Scale bar, 250 µm. Representative of n = 4 mice. b Number and distribution of transfected (mCherry+) neurons across pF subregions as defined in Fig. 4f. Bars are means ± SD across n mice and gray circles are mean values of individual mice. See methods for details. From left to right: frequency: p = 0,2532; p > 0,9999; Ti: p = 0,1975; p = 0,6264; Te: p = 0,6042; p = 0,998; amplitude: p = 0,1716; p = 0,1975 (Wilcoxon matched-pairs tests). c Raw (DiaEMG) and integrated (Int.) recordings of diaphragm activity of one representative animal at rest before (CTL), during (CNO), and after (REC) administration of CNO at 10 mg/kg. d Quantification of respiratory parameters before, during and after CNO administration: frequency, inspiratory (Ti) and expiratory (Te) times, and normalized amplitude. Note that silencing RTNPhox2b/Atoh1 neurons does not alter basal respiratory parameters. From left to right: frequency: p = 0,2532; p > 0,9999; Ti: p = 0,1975; p = 0,6264; Te: p = 0,6042; p = 0,998; amplitude: p = 0,1716; p = 0,1975 (Wilcoxon matched-pairs tests). e, f Similar representations as in c, d in mice running on a treadmill at 40 cm/s. Note the significantly lower diaphragm frequency and increased expiratory time (Te) when RTNPhox2b/Atoh1 neurons are silenced. From left to right: frequency: p = 0,0069; p = 0,1025; Ti: p = 0,5311; p = 0,3134; Te: p = 0,0089; p = 0,0987; amplitude: p = 0,0146, p = 0,4805 (paired t tests). For all graphs, gray open circles are means of individual mice, red circles are means ± SD across n mice, * denotes p < 0,05, ** denotes p < 0,01, *** denotes p < 0,001, and ns denotes p > 0,05. Source data are provided as a Source data file. See also Fig. S11.

