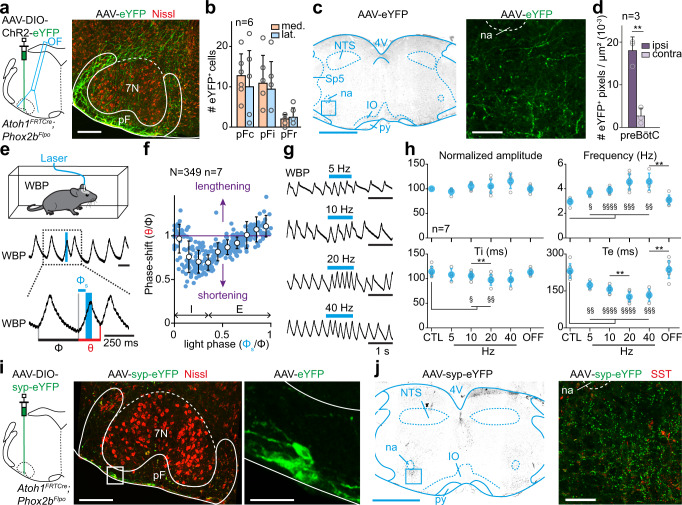
Fig. 7. RTNPhox2b/Atoh1 neurons contact the preBötC and impact respiratory rhythm generation.
a Left: strategy for labeling and photoactivating RTNPhox2b/Atoh1 neurons unilaterally. Right: transfected somas. Scale bar, 250 µm. Representative of n = 6 mice. b Distribution of transfected neurons across pF subregions defined in Fig. 4f. Bars are means ± SD across n mice and circles are mean values of individual mice. c Transverse section at the preBötC level showing RTNPhox2b/Atoh1 projections. Scale bar, 500 µm (left), 100 µm (right). d Distribution of RTNPhox2b/Atoh1 projections in the preBötC. Bars are means ± SD across n mice and gray circles are mean values of individual mice. **p = 0.0039, Wilcoxon matched-pairs test. e Top: whole-body plethysmography recording (WBP, inspirations are upwards) around a single photoactivation of RTNPhox2b/Atoh1 neurons which shortens the respiratory cycle. Φ: control cycle, φs: phase of photoactivation, θ: perturbed cycle. f Inspiratory phase-shift as a function of the phase of photoactivation showing a shortening. Blue circles are N random trials from n mice, white circles are averages ± SD across all trials within 0.1 ms bins. See Fig. 2 and methods for details. g WBP recordings during RTNPhox2b/Atoh1 photoactivation at increasing frequencies. h Respiratory parameters before (CTL), during and after (OFF) photoactivations. Gray circles are means of individual animals and colored circles are means ± SD across n mice. In all graphs, §, p < 0.05; ** or §§, p < 0.01, §§§, p < 0.001; §§§§, p < 0.0001 using Wilcoxon matched-pairs test (amplitude) and paired t tests (frequency, Ti, Te). Exact p values between conditions (*) are, from left to right: amplitude: p = 0,25; p = 0,9375; p = 0,3125; p = 0,125; frequency: p = 0,125; p = 0,1215; p = 0,3527; p = 0,0066; Ti: p = 0,684; p = 0,0025; p = 0,2645; p = 0,0523; Te: p = 0,071; p = 0,0069; p = 0,1537; p = 0,0014. Additional statistics compared to CTL condition (§): amplitude: CTL vs 5 Hz, p = 0,125; CTL vs 10 Hz, p = 0,2188; CTL vs 20 Hz, p = 0,4688; CTL vs 40 Hz, p = 0,125; CTL vs OFF, p = 0,8125; frequency: CTL vs 5 Hz, p = 0,0204; CTL vs 10 Hz, p < 0,0001; CTL vs 20 Hz, p = 0,0001; CTL vs 40 Hz, p = 0,0017; CTL vs OFF, p = 0,3061; Ti: CTL vs 5 Hz, p = 0,0651; CTL vs 10 Hz, p = 0,042; CTL vs 20 Hz, p = 0,0031; CTL vs 40 Hz, p = 0,0903; CTL vs OFF, p = 0,7401; Te: CTL vs 5 Hz, p = 0,0082; CTL vs 10 Hz, p < 0,0001; CTL vs 20 Hz, p < 0,0001; CTL vs 40 Hz, p = 0,0003; CTL vs OFF, p = 0,6141. i Left: strategy for labeling RTNPhox2b/Atoh1 synaptic contacts unilaterally. Middle: transverse section showing transfected somas in the pF. Scale bar, 250 µm. Right: magnification. Scale bar, 50 µm. j Transverse section at the preBötC level showing RTNPhox2b/Atoh1 synaptic contacts. Scale bar, 1 mm (left), 100 µm (right). i, j are representative of n = 4 animals. For all graphs, source data are provided as a Source data file. See also Fig. S12.

