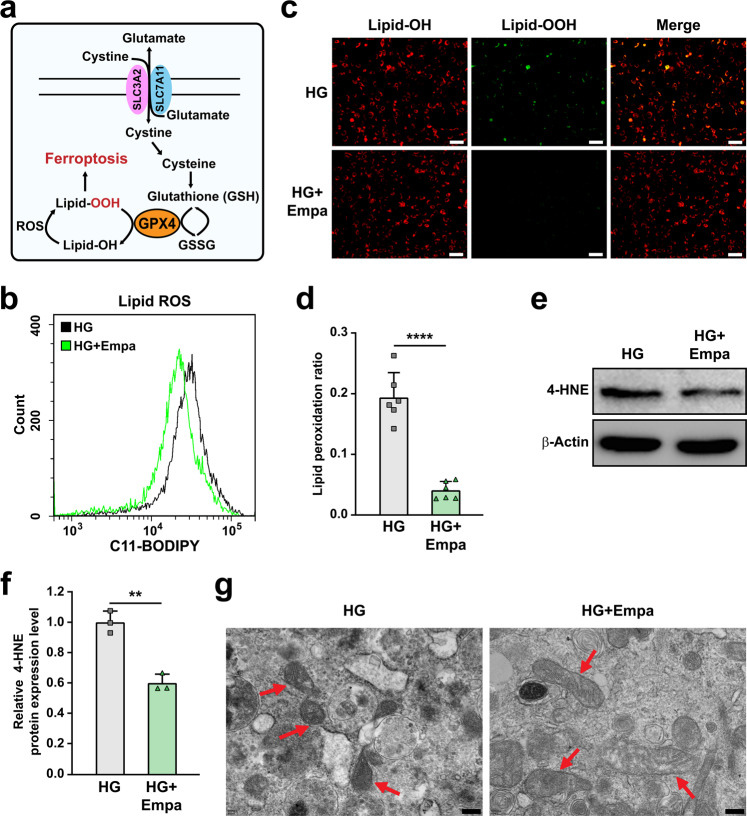
Fig. 2. Empagliflozin inhibits ferroptosis in skeletal muscle cells under hyperglycemia.
a Schematic diagram of molecular mechanism of ferroptosis. b Lipid ROS level in empagliflozin-treated C2C12 cells, as examined using C11-BODIPY staining and flow cytometry. c, d Lipid peroxidation ratio in empagliflozin-treated C2C12 cells, as analyzed using C11-BODIPY staining. Representative images (c; scale bars: 100 μm) and quantification results (d; n = 6) were shown. e, f 4-HNE level in C2C12 cells treated with empagliflozin, as examined using Western blotting. Representative images (e) and quantification results (f) were shown. β-Actin was used as loading control. g Transmission electron microscopy images of the mitochondria in C2C12 cells treated with empagliflozin. Red arrows: mitochondria; scale bars: 200 nm. All experiments were performed under hyperglycemia. Data were presented as mean ± SD (n = 3, unless further indicated). HG hyperglycemia, Empa: 10 μM empagliflozin; **P < 0.01; ****P < 0.0001.

