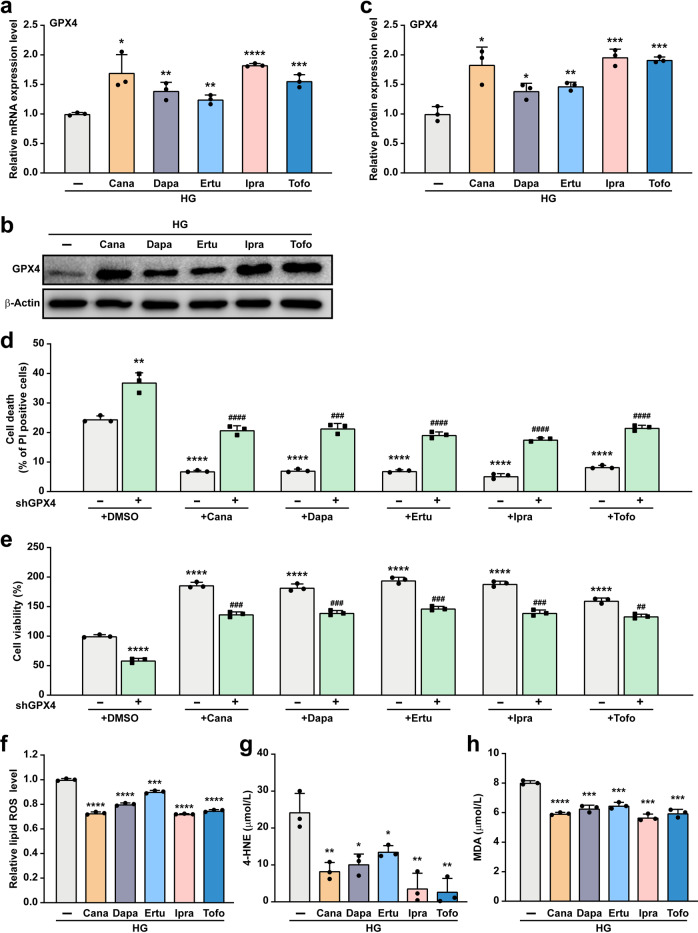
Fig. 5. Gliflozins inhibit ferroptosis under hyperglycemia through GPX4.
mRNA (a) and protein (b, c) expression of GPX4 in C2C12 cells treated with 10 μM of indicated gliflozins, as examined using qRT-PCR and Western blotting, respectively. Representative images (b) and quantification results (c) were shown. β‐Actin was used for qRT-PCR normalization and as Western blotting loading control. d Cell death rate in GPX4-knocked down C2C12 cells treated with 10 μM of indicated gliflozins, as examined using PI staining and flow cytometry. e Cell viability in GPX4-knocked down C2C12 cells treated with 10 μM of indicated gliflozins. f Lipid ROS level in C2C12 cells treated with 10 μM of indicated gliflozins, as examined using C11-BODIPY staining and flow cytometry. 4-HNE (g) and MDA (h) levels in C2C12 cells treated with 10 μM of indicated gliflozins, as analyzed using ELISA and Lipid Peroxidation MDA Assay Kit, respectively. All experiments were performed under hyperglycemia. Data were presented as mean ± SD (n = 3). HG hyperglycemia; *P < 0.05; **P < 0.01; ***P < 0.001; ****P < 0.0001 versus shCon; while #P < 0.05; ##P < 0.01; ###P < 0.001; ####P < 0.0001 versus shGPX4.

