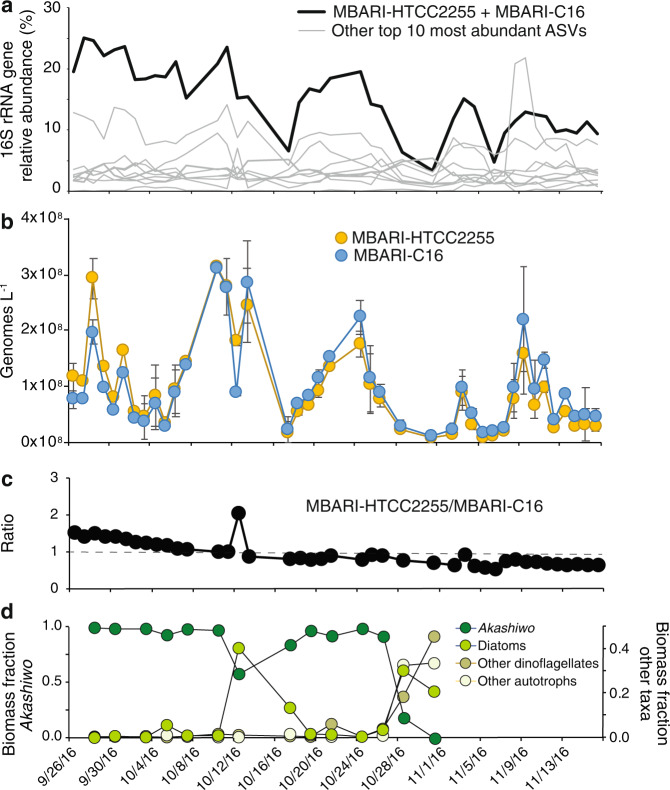
Fig. 1. Abundance of NAC11-7 syntopic species.
a Relative abundance of the top 10 most abundant ASVs; the bolded line represents the ASV that is identical between MBARI-HTCC2255 and MBARI-C16, while the gray lines represent the nine other most abundant ASVs. b Copies per liter of seawater of each species’ genome. c Ratio of MBARI-HTCC2255 to MBARI-C16 genomes. d Phytoplankton biomass composition (September 28- through October 31, 2016). Akashiwo sanguinea was the dominant phytoplankton species through the majority of the bloom.

