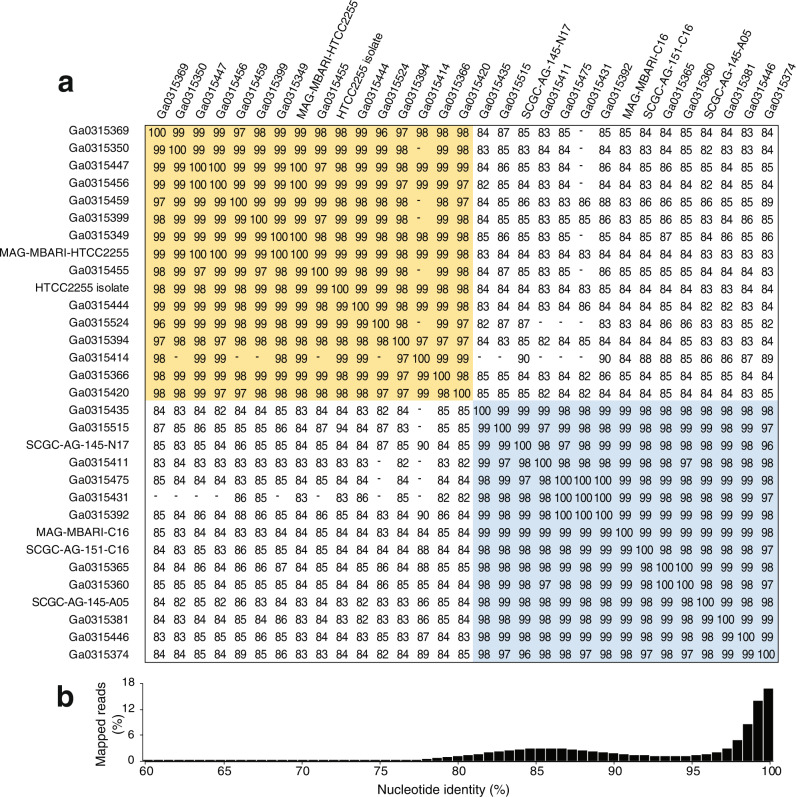
Fig. 2. Evidence for NAC11-7 lineage sequence-discrete clusters represented by a single ASV in Monterey Bay.
a Estimated all-vs-all Average Nucleotide Identity (ANI) distances and similarity clustering of 31 genomes from assembled metagenomic data (MAGs), single amplified genomes (SAGs), and the HTCC2255 isolate. Values are missing if the number of shared genes was too low for accurate ANI calculations. Gold shading indicates MBARI-HTCC2255 clade genomes, all clustering at >95% ANI, and blue shading indicates MBARI-C16 clade genomes, all clustering at >95% ANI. b Nucleotide percent identity of metagenomic reads mapping to the HTCC2255 isolate genome (example from metagenomic sample 46D).

