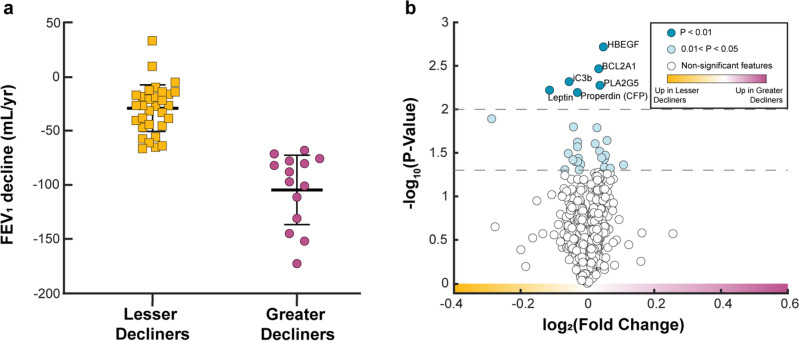
Figure 1.
Individual blood and BAL proteins cannot discriminate between annualized greater versus lesser rates of FEV1 decline in COPD. (a) Comparison of annualized post-bronchodilator FEV1 decline from V1 to V5. Decline was calculated as (V5 FEV1 – V1 FEV1)/ time, where time is the duration in years between V1 and V5 for each participant. (b) Volcano plot of blood and BAL proteins. Light and dark blue protein markers have a p-value < 0.05 and < 0.01, respectively, after a two-sampled two-tailed t-test. All depicted p-values are before correction for multiple comparisons. No proteins remained significant after applying the Benjamini-Hochberg false discovery rate (FDR) correction for multiple comparisons (α = 0.05).

