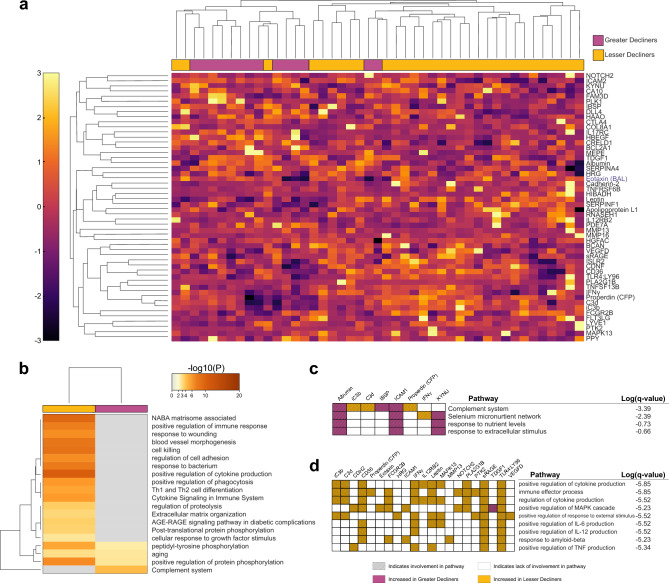
Figure 3.
Clustering of COPD subjects by the EN-identified signature highlights distinct regulation of immune-associated processes. (a) Hierarchical clustering of the 52-feature signature highlights distinct clustering of greater decliners (magenta) and lesser decliners (yellow). Only 5 out of the 45 subjects were misclassified (Sensitivity: 85.7%, Specificity: 90.3%). BAL proteins denoted by blue text. (b) Significantly enriched ontology clusters by Metascape analysis. (c, d) Pathways encompassed in the (c) complement system cluster and in the (d) positive regulation of cytokine production cluster are listed in the table. Hatched squares indicate protein involvement in a particular pathway, colorations of magenta or yellow represent a relative elevation of the protein concentration in greater decliners or lesser decliners, respectively.

