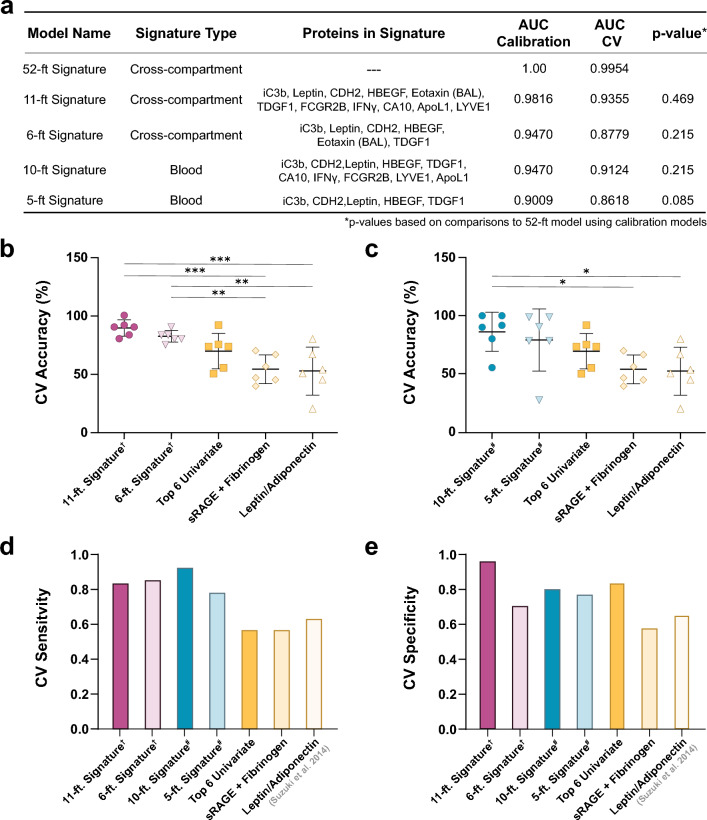
Figure 5.
Select subgroup of signature proteins retain high predictive value for accelerated FEV1 decline. (a) Table denote AUCs for both ROC curves generated from calibration and cross-validation PLSDA models. AUCs of all calibration models were compared to that of the optimal (52-feature model) using the Hanley and McNeil method58. (b) Comparisons of 6-fold CV accuracies of multi-compartment and (c) blood-only biomarker models to a collection of the 6 top proteins identified in Fig. 1, and literature models, as determined by ANOVA with Bonferroni’s post hoc test (*p<0.05, **p < 0.01, ***p<0.001). (d) Sensitivity and (e) specificity of signatures. All reported values are from cross-validated PLSDA models, unless otherwise noted. (†: multi-compartment model, #: blood-only model). CV: cross-validated; AUC: area under curve.

