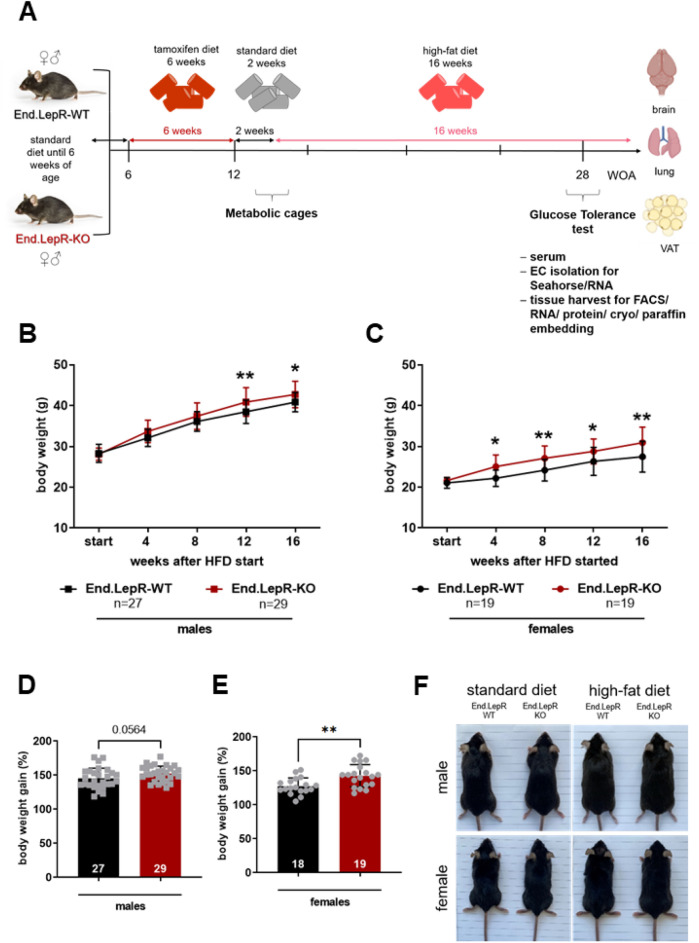
Figure 2.
Body weight changes in response to high-fat diet. (A) Experimental work flow. Body weight progression curves of male (B) and female (C) End.LepR-WT and End.LepR-KO mice at the start and after feeding high-fat diet (HFD) for 4, 8, 12 and 16 weeks. The number of mice examined per group is shown in the graphs. *p < 0.05 and **p < 0.01, as determined using Two-Way ANOVA, Sidak’s multiple comparison test. Body weight gain after 16 weeks of HFD, expressed as percentage of initial body weight (set at 100%), in male (D) and female (E) End.LepR-WT and End.LepR-KO mice. **p < 0.01, as determined using Student’s t test. (F) Representative photographs of male and female End.LepR-WT and End.LepR-KO mice fed standard laboratory diet or high-fat diet for 16 weeks.

