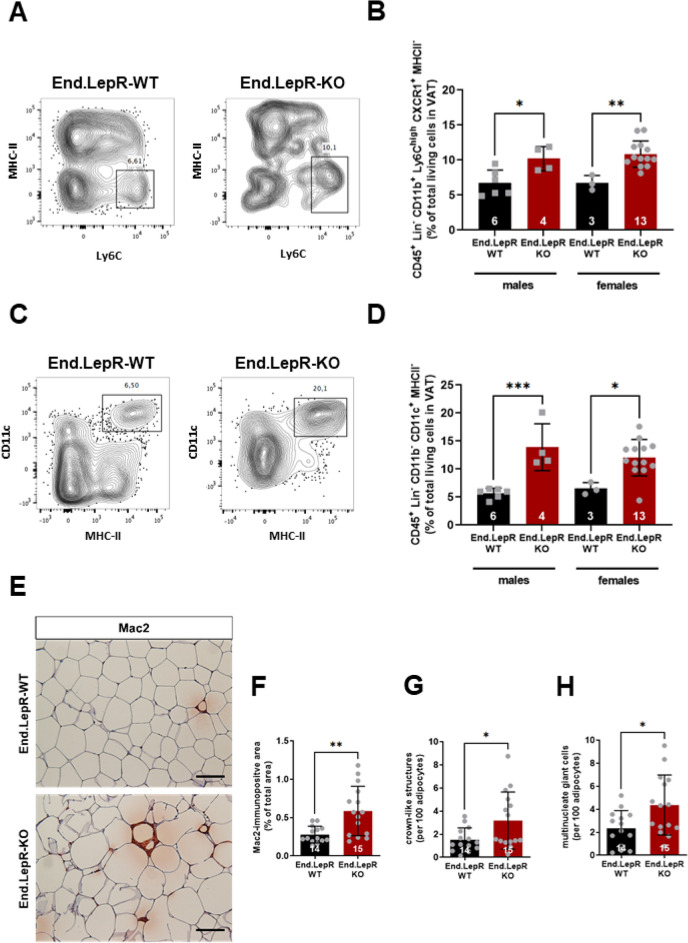
Figure 4.
Visceral adipose tissue inflammation. Immune cell subsets were analyzed in visceral adipose tissue (VAT) homogenates of End.LepR-WT and End.LepR-KO mice fed high-fat diet (HFD) for 16 weeks using flow cytometry. Representative dot plots after analysis of MHC-II and Ly6C are shown in (A), of CD11c and MHC11 in (C), the results of the quantitative analysis of CD45+ Lin− CD11b+ Ly6Chigh CXCR1+ MHCII− cells in (B) and of CD45+ Lin− CD11b− CD11c+ MHCII− in (D), respectively. Data are expressed as % of total living cells in VAT and were compared using One-Way ANOVA, Sidak’s multiple comparisons test. *p < 0.05, **p < 0.01 and ***p < 0.005. (E) Representative images after immunohistochemical analysis of macrophages in VAT of End.LepR-WT and End.LepR-KO mice fed HFD for 16 weeks. Scale bars represent 100 μm. The results of the quantitative analysis of the Mac2-immunopositive area are shown in (F), the number of crown-like structures (CLS) or nucleated giant cells per 100 adipocytes are shown in (G) and (H), respectively. Data were analyzed using Student’s t test. *p < 0.05 and **p < 0.01.

