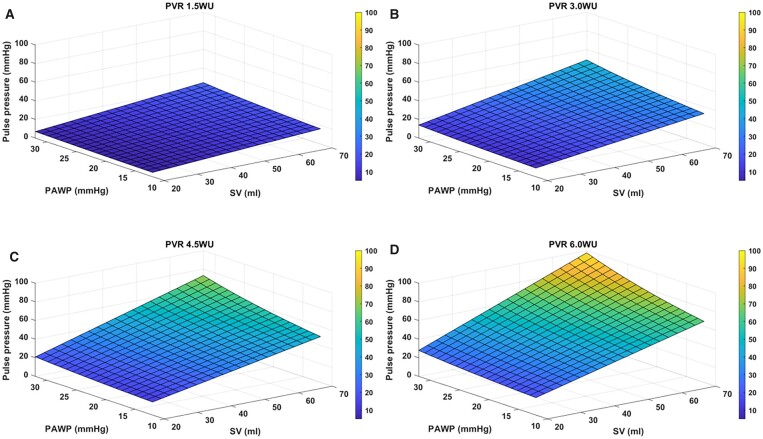
Figure 3:
Pulmonary artery pulse pressure modelled over a range of pulmonary arterial wedge pressures, stroke volumes and pulmonary vascular resistances. Graphs A–D were modelled on a PVR of 1.5WU, 3WU, 4.5WU and 6WU, respectively, indicating increasing pulse pressure with increasing PVR. PVR: pulmonary vascular resistance.

