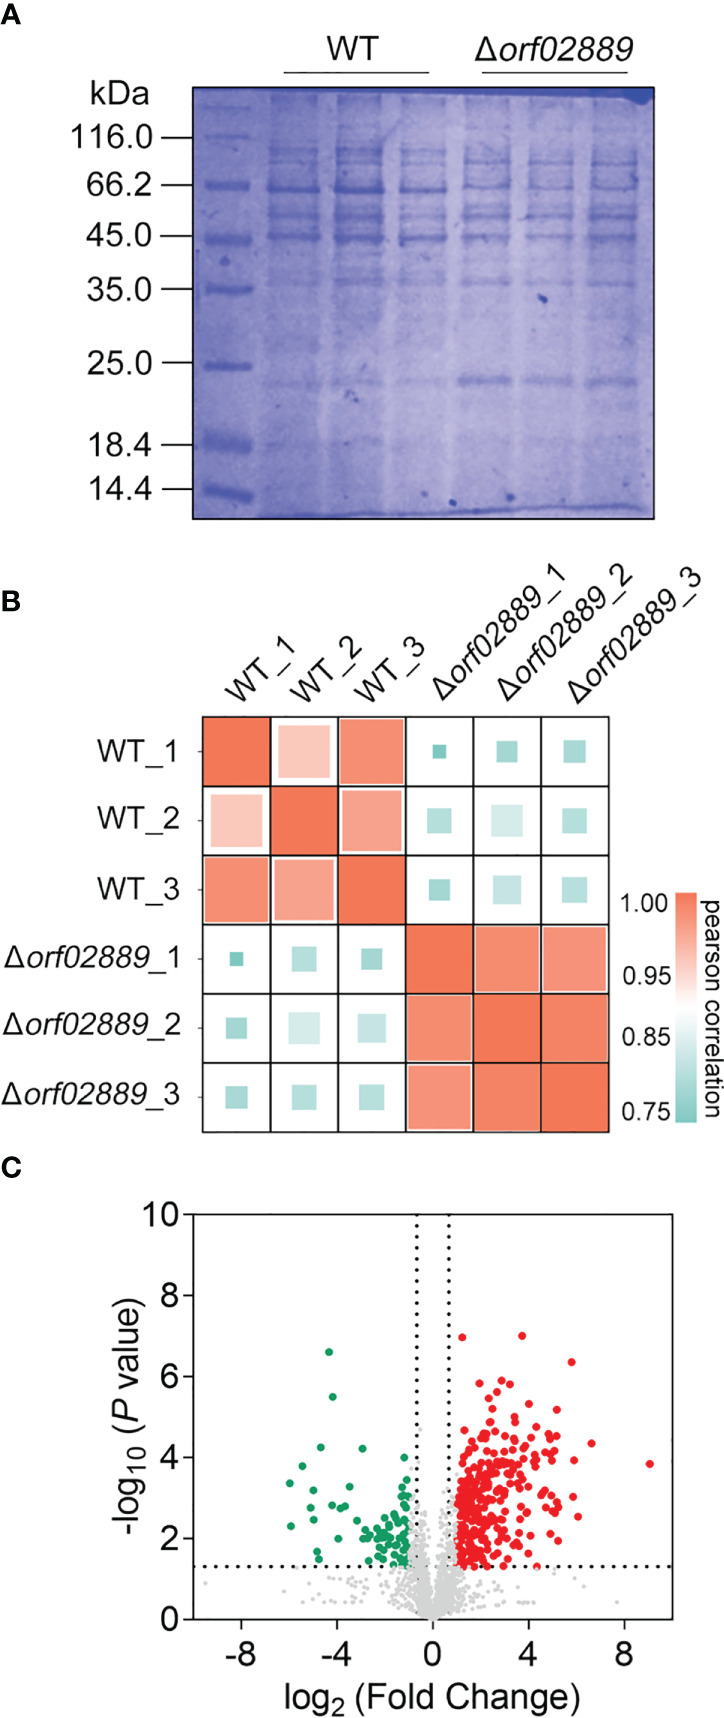
Figure 2.

Quantitative proteomic data analysis. (A) Coomassie bright blue SDS-PAGE of extracellular proteins extracted from A. hydrophila LP-2 and Δorf02889; (B) Pearson correlation assay of protein intensities for three biological replicates from each group. (C) Volcano plot showing the abundance ratios of significant DEPs. Red points represent differentially expressed upregulated proteins, green points represent downregulated proteins, and gray points indicate non-differentially expressed proteins.
