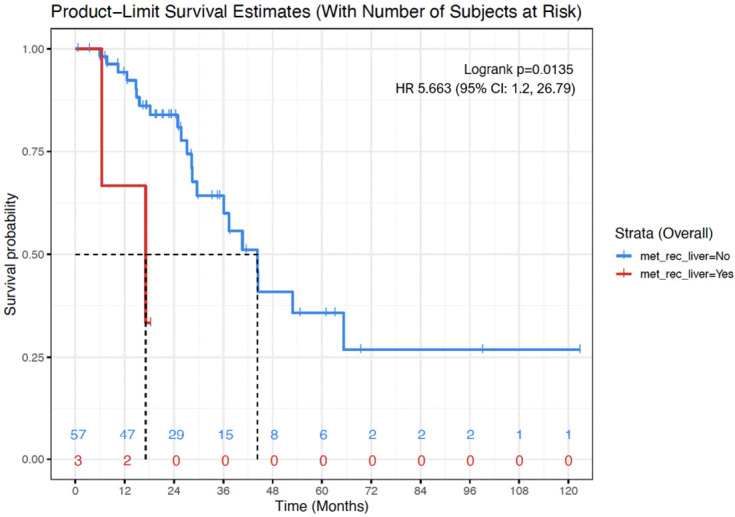
Figure 3.

Kaplan-Meier OS curve for women with evidence of liver metastases/recurrence (red) versus women with no evidence or liver metastases or recurrence (blue). Presence of liver metastases/recurrence was associated with shorter OS (mean, 48.8 months vs 58.4 months; Cox proportional hazard model - Hazard Ratio: 5.66; 95% CI: 1.2, 26.79; p=0.01). Numbers at the bottom of the graph refers to the number of women with evidence of liver metastases/recurrence (red) versus women with no evidence or liver metastases or recurrence (blue) at risk at a determinate timepoint.
