
FIGURE 1.
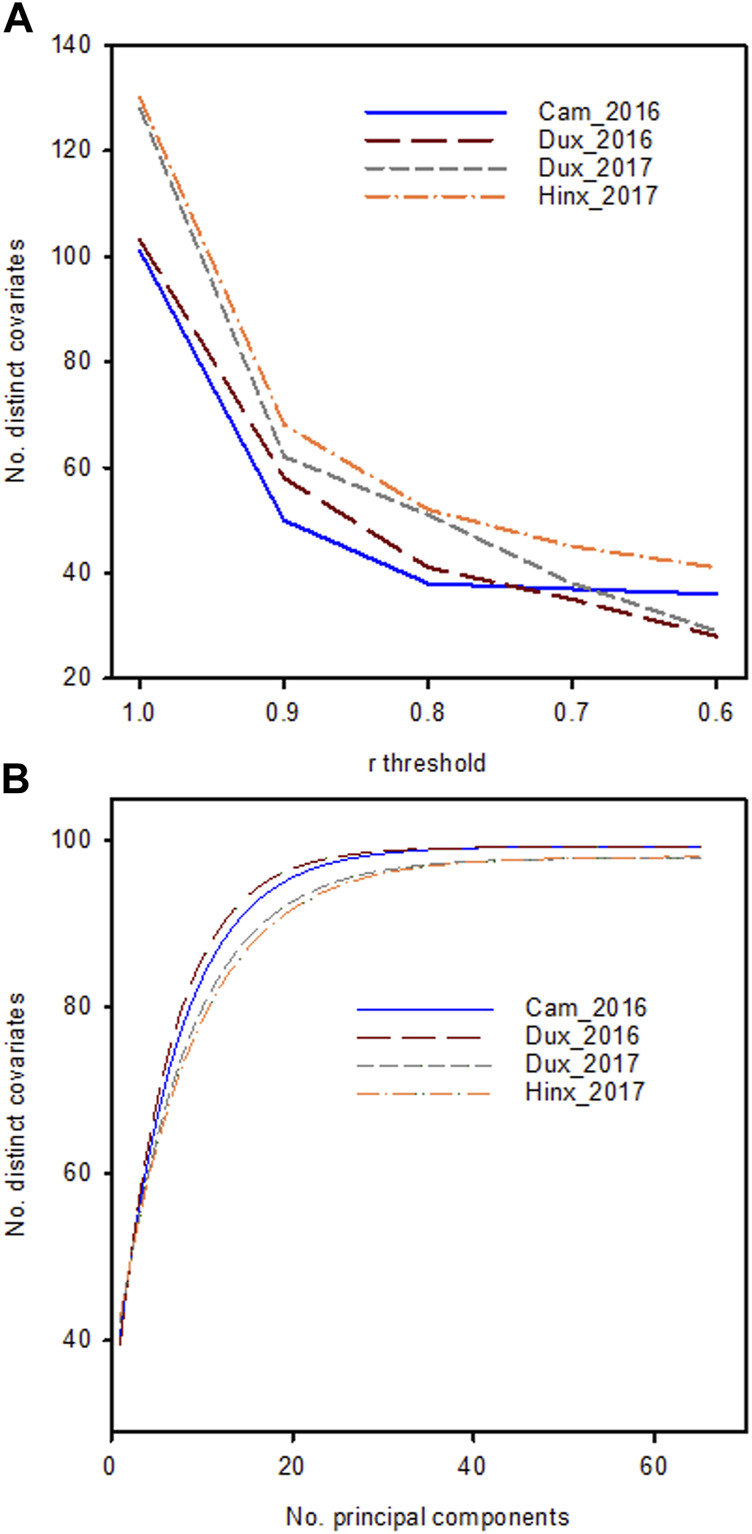
(A): Number of unique traits in the phenomic data set in the four location/year combinations with mutual correlations lower than the threshold on the x-axis (B): Cumulative explained variance as a function of the number of principal components included. Lines are fitted to data using a spline curve fitting procedure.