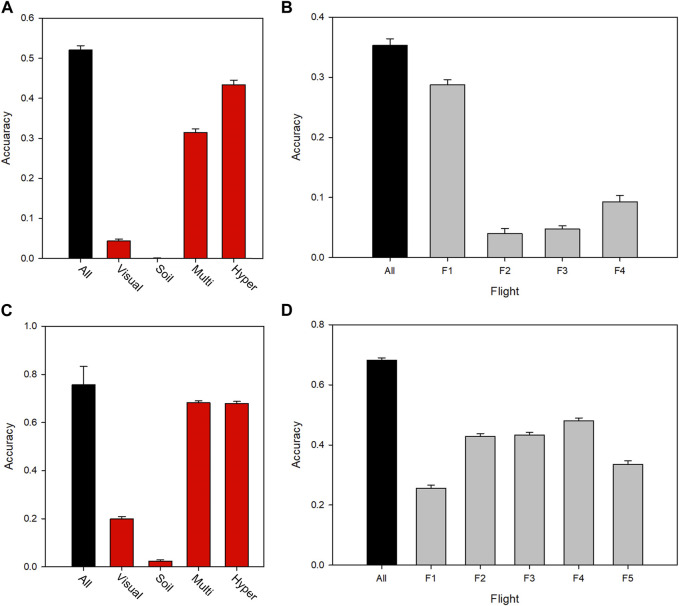
FIGURE 4.
Yield prediction accuracy for different sources, types and times of measurement for 2016 (top panels) and 2017 (bottom panels), leaving out a random 50% of plots from both locations for validation of the model training set. (A) (2016) and (C) (2017) show prediction accuracy for data subsets in each year, in which traits were classified according to data type. (B) (2016) and (D) (2017) show the predictive power of the multispectral trait datasets in each year, separated by time of measurement, F1-F5 (spanning the period mid-spring until the end of summer). Supplementary Table S1 shows the dates of each flight (F). Error bars indicate standard deviation over the data re-samplings.

