
FIGURE 6.
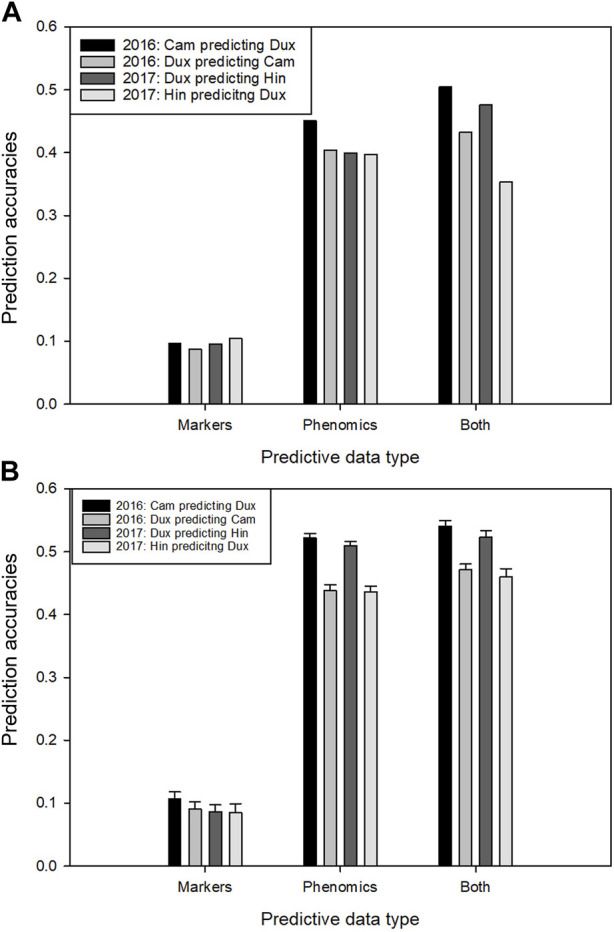
Prediction of yield for full trial locations within each trial year using two types of predictive data: markers, phenomic trait data and these two combined. (A) Four within-year combinations of a prediction model trained on yield line averages of one location, applied to predict yield on the other location, using marker data, phenomic data and both. (B) as in A, however here the training sets have been supplemented with 10% random fractions of the same data types from the test location. Error bars indicate standard deviation over the data re-samplings.