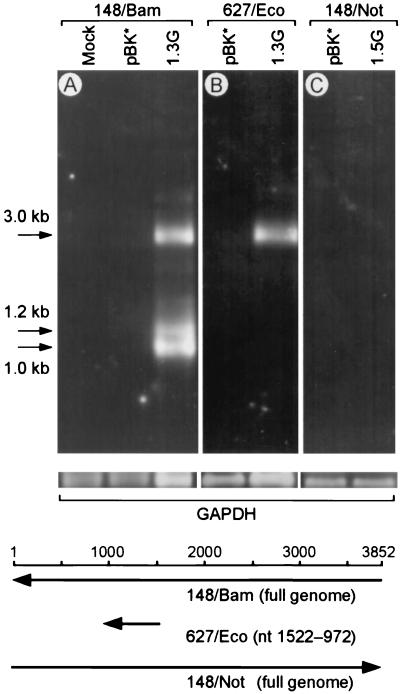
FIG. 2.
Expression of TTV mRNA in COS1 cells. In the upper panel, poly(A)+ RNAs of COS1 cells harvested 48 h posttransfection were hybridized with the genomic 148/Bam probe (A), the genomic 627/Eco probe (nt 1522 to 972) (B), or the antigenomic 148/Not probe (C). Lanes: Mock, mock transfection; pBK*, transfection with pBK*; 1.3G, transfection with pBK*VT416(1.3G); 1.5G, transfection with pBK*VT416(1.5G). The positions of 3.0-, 1.2-, and 1.0-kb mRNAs are indicated by arrows on the left. In the middle panel, parallel runs were hybridized with the glyceraldehyde-3-phosphate dehydrogenase (GAPDH) probe as a loading control. Positions and orientations of the probes are shown below the gels.

