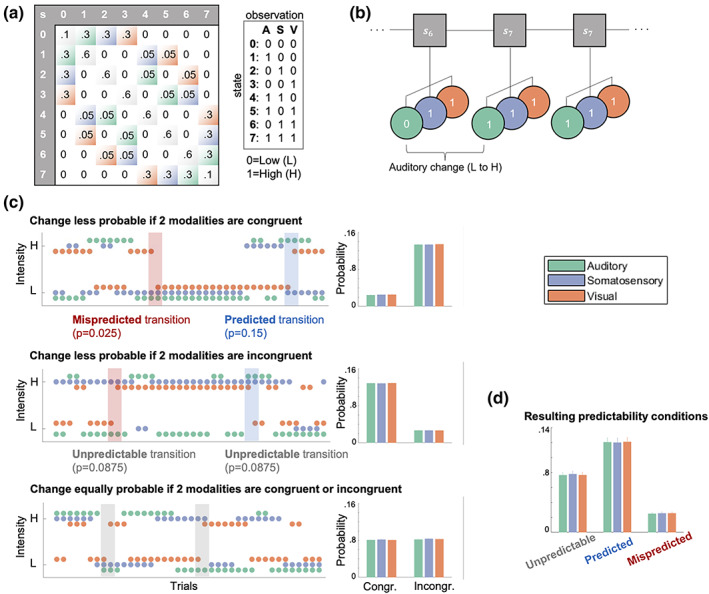
FIGURE 2.

Probabilistic sequence generation. (a) Schematic of state transition matrix (left). Light color shading depicts transitions in the respective modality which were assigned specific transition probabilities: Green = auditory change, purple = somatosensory change, orange = visual change, gray diagonal = tri‐modal repetition, white = multimodal change (set to zero). States 0–7 correspond to a specific stimulus combination (right), that is, eight permutations of low (0) and high (1) stimuli across three modalities (A = auditory; S = somatosensory; V = visual) as described in the main text. (b) Visualization of states (s) evolving according to a Markov chain emitting tri‐modal binary outcomes. (c) Probability settings of stimulus sequences. Left column: Sequences. Right column: Averaged empirical change probabilities across all sequences. Top: Transition probabilities determine that for each modality a change is unlikely (p = .025) if the other two modalities are congruent (and likely if they are incongruent; p = .15). Middle: Transition probabilities determine that for each modality a change is likely (p = .15) if the other two modalities are congruent (and unlikely if they are incongruent; p = .025). Bottom: Transition probabilities determine that for each modality a change is equally likely (p = .0875) if the other two modalities are congruent or incongruent. (d) Averaged empirical change probabilities for predictability conditions.
