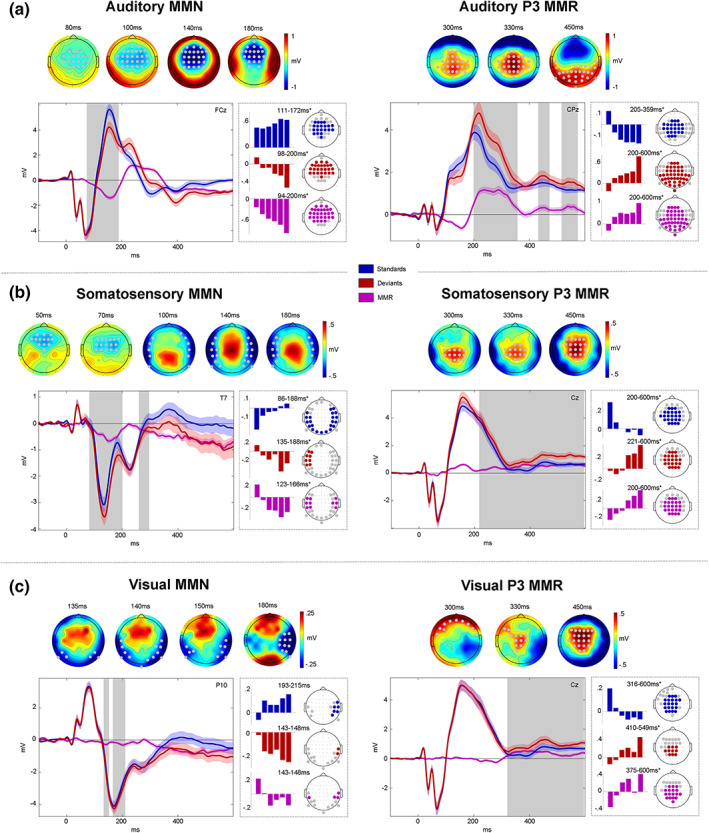
FIGURE 3.

Mismatch responses. Panels (a–c) show mismatch responses (MMRs) of auditory (a), somatosensory (b), and visual (c) modalities. Within panels: Left: mismatch negativity (MMN). Right: P3 MMR. Gray dots (top) and gray boxes (bottom) indicate significant MMR electrodes and time points with . Top row: MMR scalp topographies (deviants‐standards). Bottom row: Grand average ERPs (left panels) and beta parameter estimates of significant linear contrast clusters (right panels). Colored bars depict six beta parameter estimates of the TrainLength GLM (1, 2, 3, 4–5, 6–8, >8 repetitions) averaged across electrodes within linear contrast clusters. Asterisks indicate significance of the linear contrast ().
