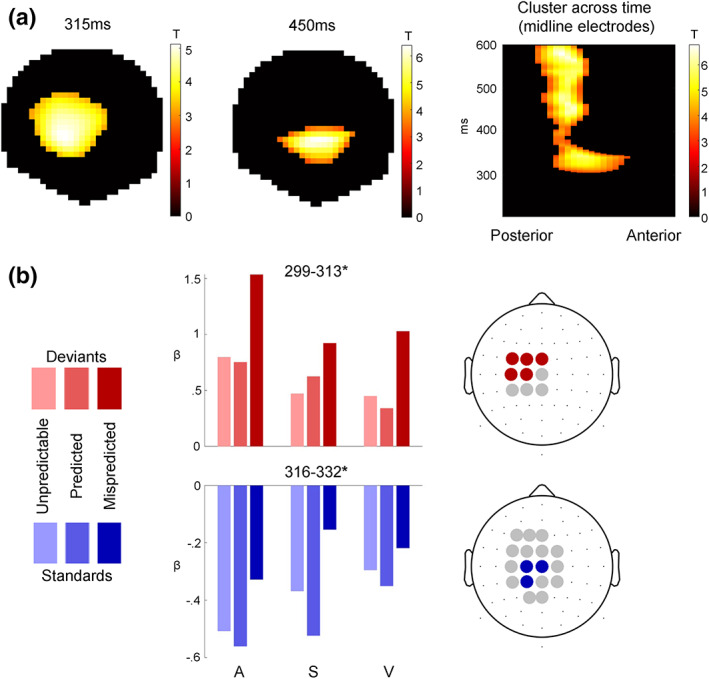
FIGURE 4.

Cross‐modal P3 effects. (a) T‐Maps of the conjunction of deviant > standard contrasts across the auditory, somatosensory, and visual modalities. (b) Beta estimates averaged across electrodes within significant clusters with peak <0.05, resulting from two‐way ANOVAs testing for differences between unpredictable, predicted, and mispredicted deviants (red) and standards (blue).
