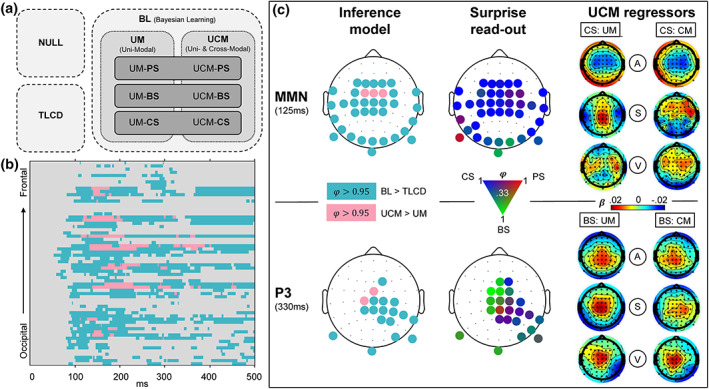
FIGURE 6.

Modeling results. (a) Schematic overview of models. Model comparison 1 (light‐gray box, dashed contour): Null model family (NULL), train length‐dependent change detection model family (TLCD), and Bayesian learning model family (BL). Comparison 2 (gray box, dotted contour): Unimodal regression model family (UM), cross‐modal regression model family (UCM). Comparison 3 (dark‐gray box, line contour): Read‐out model family comparison of predictive surprise family (PS), Bayesian surprise family (BS), and confidence‐corrected surprise family (CS). (b) Results of comparison 1 and 2 shown for all electrodes and poststimulus time points. Color depicts exceedance probability (EP) . Light‐blue = BL > TLCD, pink = UCM > UM. (c) Topography of modeling results at time windows of MMN (top row) and P3 (bottom row). Left column: Results of comparison 1 (same colors as (B), depicting ). Middle column: Results of comparison 3. EPs between 0.33 and 1 of the three surprise functions are represented by a continuous three‐dimensional RGB scale (red = predictive surprise [PS]; green = Bayesian surprise [BS]; blue = confidence‐corrected surprise [CS]). Right column: Beta estimates of the model regressors of the UCM model (regressors: A = auditory; S = somatosensory; V = visual; CM = cross‐modal; UM = unimodal) for CS read‐out models (top) and BS read‐out models (bottom).
