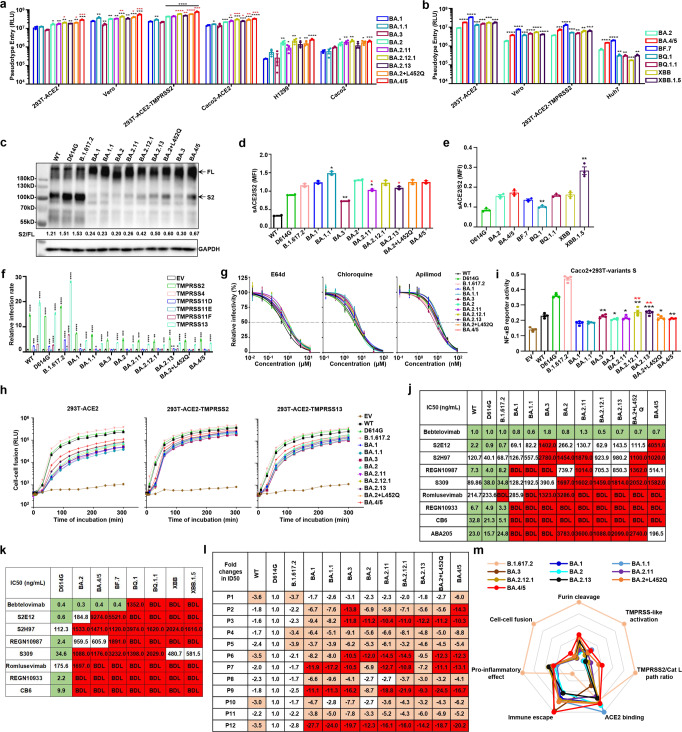
Fig. 1.
Evolutionary characteristics of SARS-CoV-2 Omicron variants adapted to the host. a, b Infectivity of Omicron sublineages pseudoviruses in different cells. c Hydrolytic cleavage of variants S proteins in 293T cells. Shown are representative blots from three experiments. d The binding activity of variants S proteins to soluble ACE2, quantified by mean fluorescence intensity (MFI), and normalized by cell surface expressed S protein (n = 2). e The binding activity of BA.4/5, B.7, BQ.1, BQ.1.1, XBB and XBB.1.5S proteins to soluble ACE2. f Infectivity of variants pseudoviruses in 293T-ACE2 cells transiently expressing different transmembrane serine proteases. g Endocytosis and protease inhibitors effectively blocked the entry of variants pseudoviruses into 293T-ACE2 cells. 293T-ACE2 cells were pretreated with different concentrations of inhibitors (E64d, Chloroquine and Apilimod) and then infected with variants pseudoviruses. h SARS-CoV-2 variants S proteins mediated cell-cell fusion assay. i NF-κB reporter activation in Caco2 cells mediated by incubation with 293T cells expressing variants S proteins. j, k Neutralizing activity of therapeutic neutralizing mAbs against variants pseudoviruses. Green, IC50 < 50 ng/mL; Red, IC50 > 1000 ng/mL; BDL indicates neutralizing activity below detection limit. l Fold changes of vaccine sera neutralization activity between variants and D614G pseudoviruses, and “−” represents the decrease of sensitivity of vaccine sera, and “+” represents the increase of sensitivity of vaccine sera. The values are marked in red, indicating that sensitivity is decreased at least 3-fold. m Radar chart of Omicron sublineages characteristics. Experiments were done in 3-4 replicates and repeated at least twice. One representative is shown with error bars indicating SEM. In Fig. 1a, d, i, black stars represent statistical differences of all Omicron sublineages compared to the BA.1 strain, while red stars represent statistical differences of all BA.2 sublineages compared to the BA.2 strain. EV indicates empty vector

