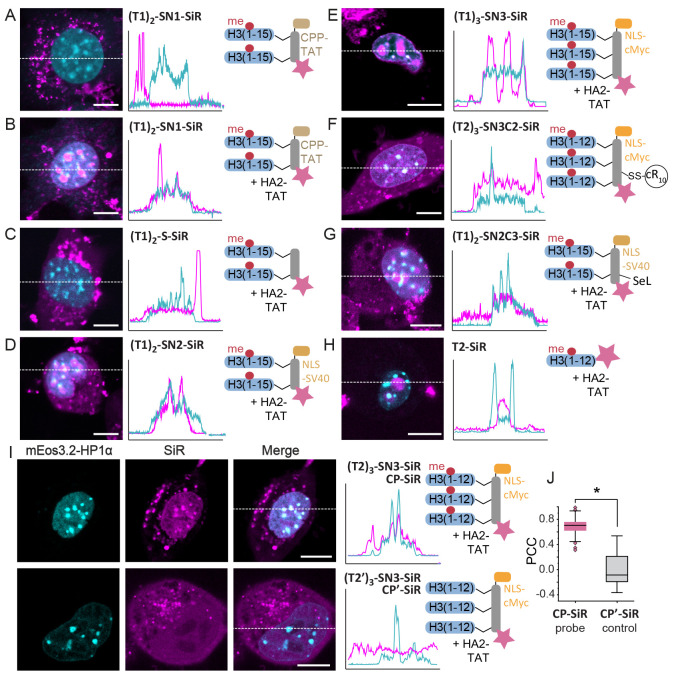
Figure 3.
Development of a heterochromatin targeting peptide probe. (A–H) Confocal microscopy images of 3T3 fibroblasts treated with the indicated peptides. SiR fluorescence emission of the indicated peptide probes (magenta) is overlaid with HP1α-mEOs3.2 fluorescence (cyan). 2D intensity profiles corresponding to the dotted lines displayed on the images (line scans) are depicted to the right of the micrographs. (I) Confocal microscopy images and line scans of 3T3 fibroblasts treated with CP-SiR probe (i.e., T23-SN3-SiR, top) or the K9A variant CP′-SiR. J) Correlation between HP1α-mEOs3.2 and CP-SiR or CP′-SiR staining, demonstrating good colocalization for CP-SiR, and the dependence on the presence of the H3K9me3 modification in CP-SiR for heterochromatin staining (see Supporting Information for details on the calculation). N = 21 cells (CP-SiR), N = 10 cells (CP′-SiR). PCC: Pearson correlation coefficient.Two-sample t test: *p < 4 × 10⁻⁷, scale bars: 10 μm.

