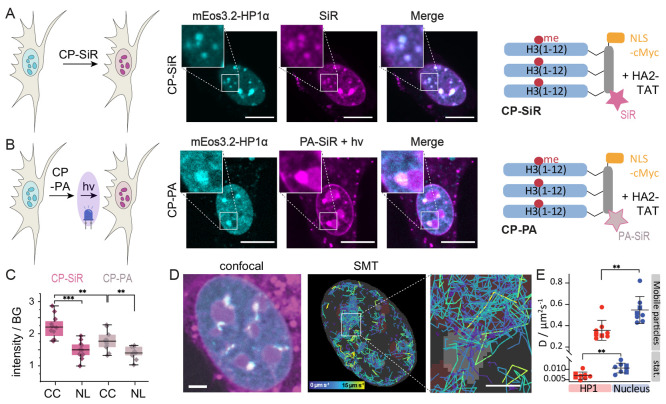
Figure 5.
A photoactivatable probe to investigate chromocenter properties. (A) Heterochromatin staining using CP-SiR. (B) Heterochromatin staining using CP-PA after photoactivation. PA-SiR after 405 nm photoactivation (magenta), HP1α-mEOs3.2 fluorescence (cyan). (C) CP-SiR compared to CP-PA fluorescence intensity after photoactivation in chromocenters (CC), compared to nucleoli (NL). (D) Single-molecule tracks inside the nucleus, colored by velocity. HP1α foci from the reference channel are shown in gray, and approximate positions of nucleoli are depicted in dark red. Fast-diffusing molecules are mostly found outside HP1α foci. Molecules that get immobilized after photoactivation have stationary tracks, colored in purple. (E) Diffusion coefficient estimates for molecules within HP1α foci and in the rest of the nucleus are based on analyzing jump distances in live cells (N = 8, 10 000 frames). Tracks recorded in different imaging wells are distinguished by the circle and square symbols. Error bars represent standard deviation. Scale bars: A, B = 10 μm, D = 3 μm, inset: 1 μm.

