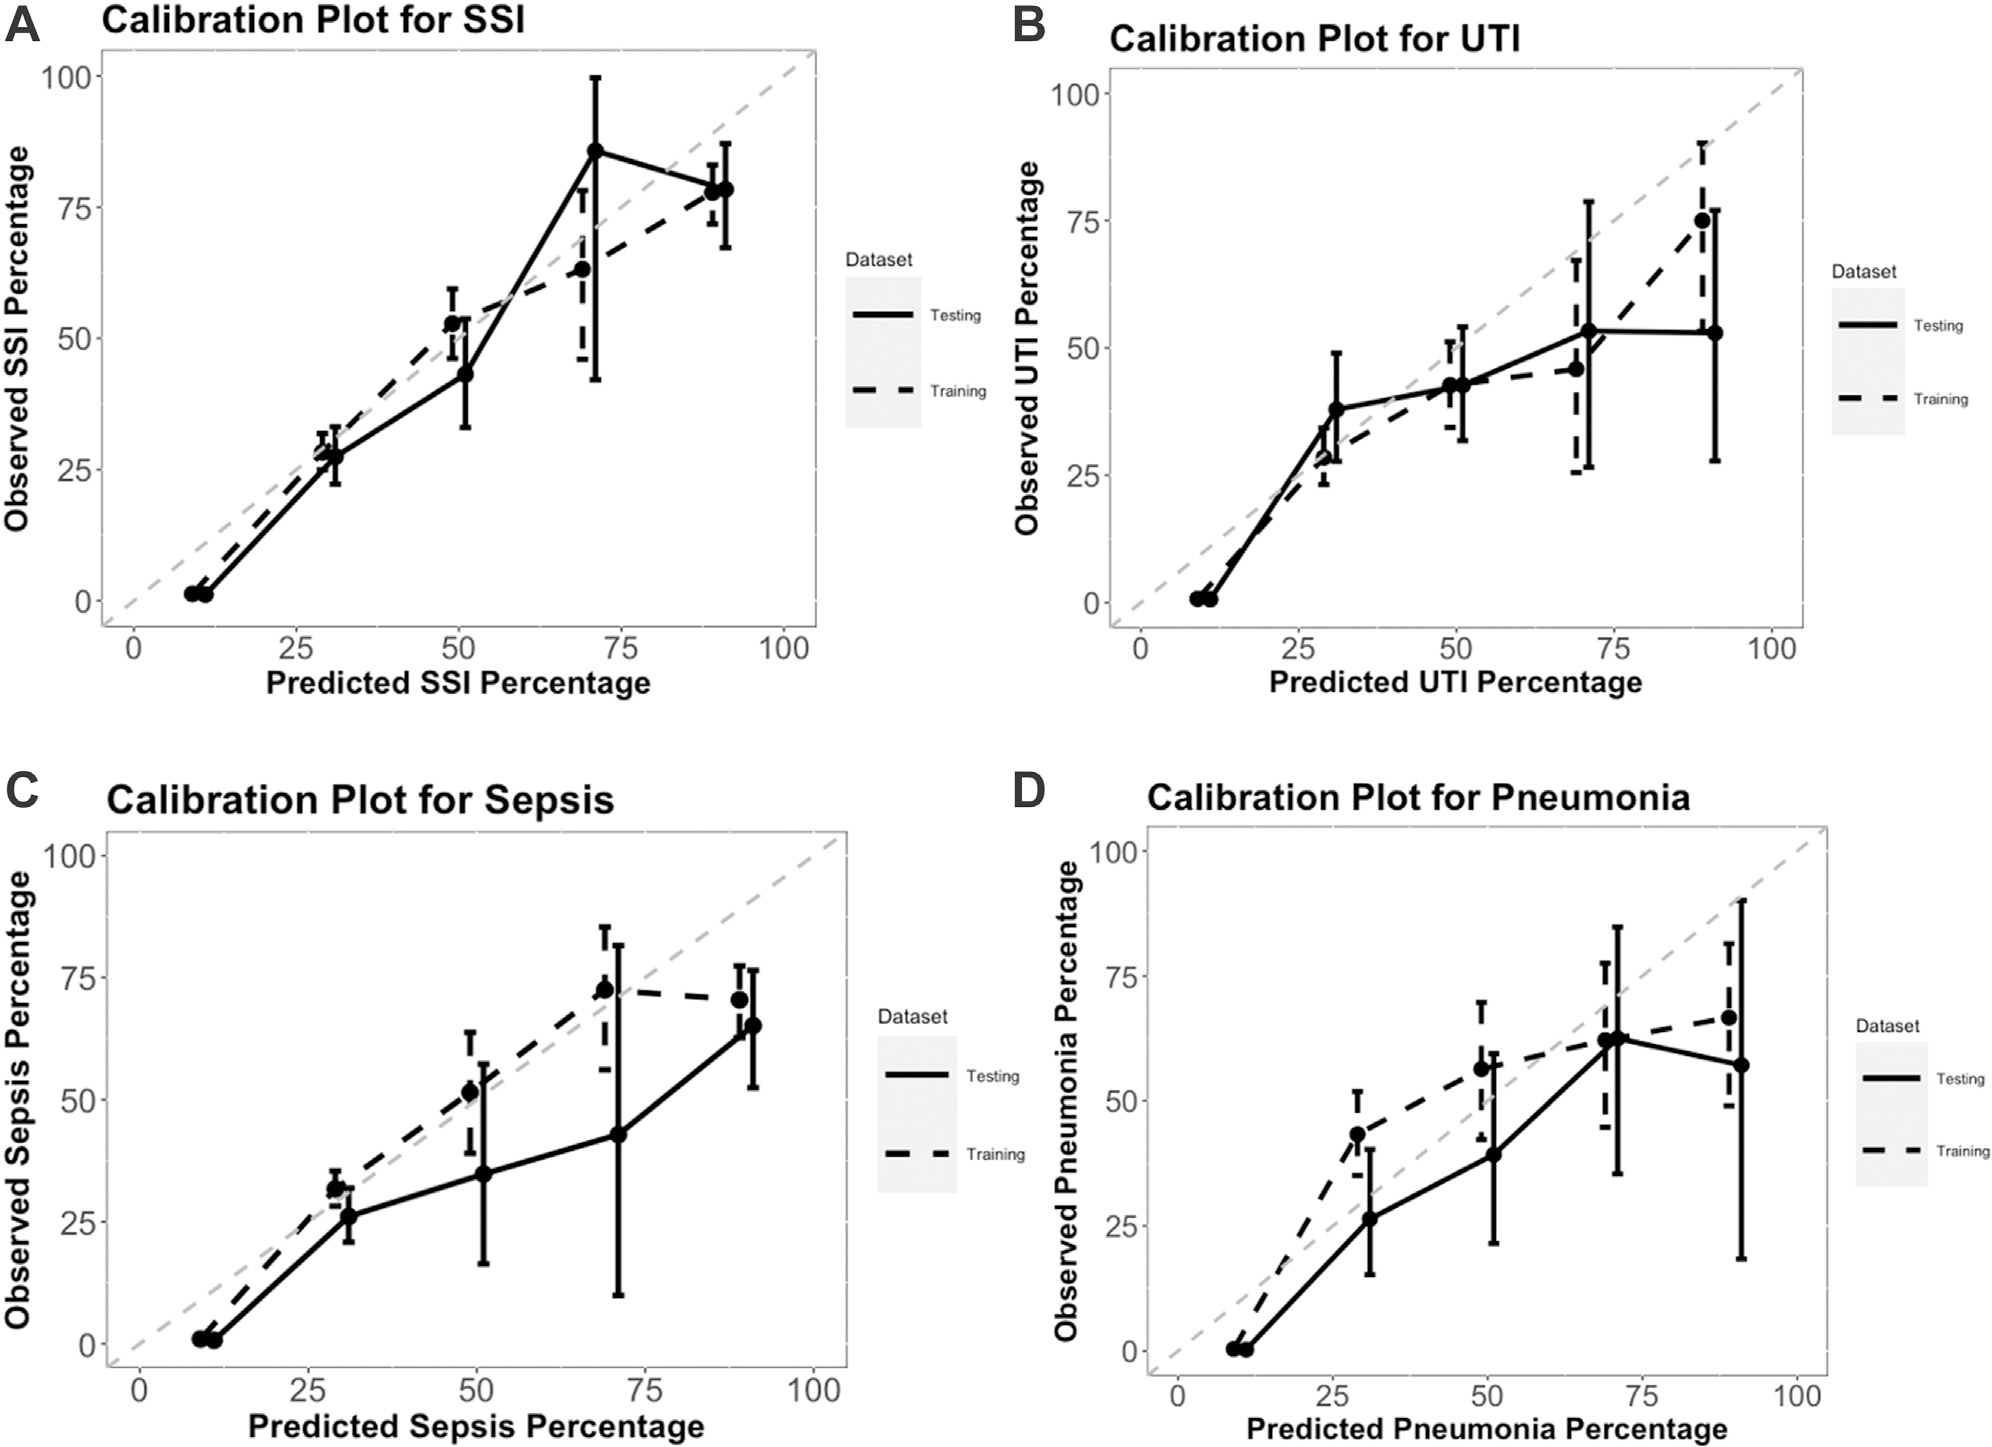
Figure 2.

Calibration plots for each model applied to the training and test datasets: (A) surgical site infection, (B) urinary tract infection, (C) sepsis, (D) pneumonia. The dots signify the mean predicted values by the observed complication rates; whiskers represent the 95% CIs of the observed rates based on the binomial distribution; and perfect estimation is indicated in these plots by the gray 45° line. SSI, surgical site infection; UTI, urinary tract infection.
