
Figure 3.
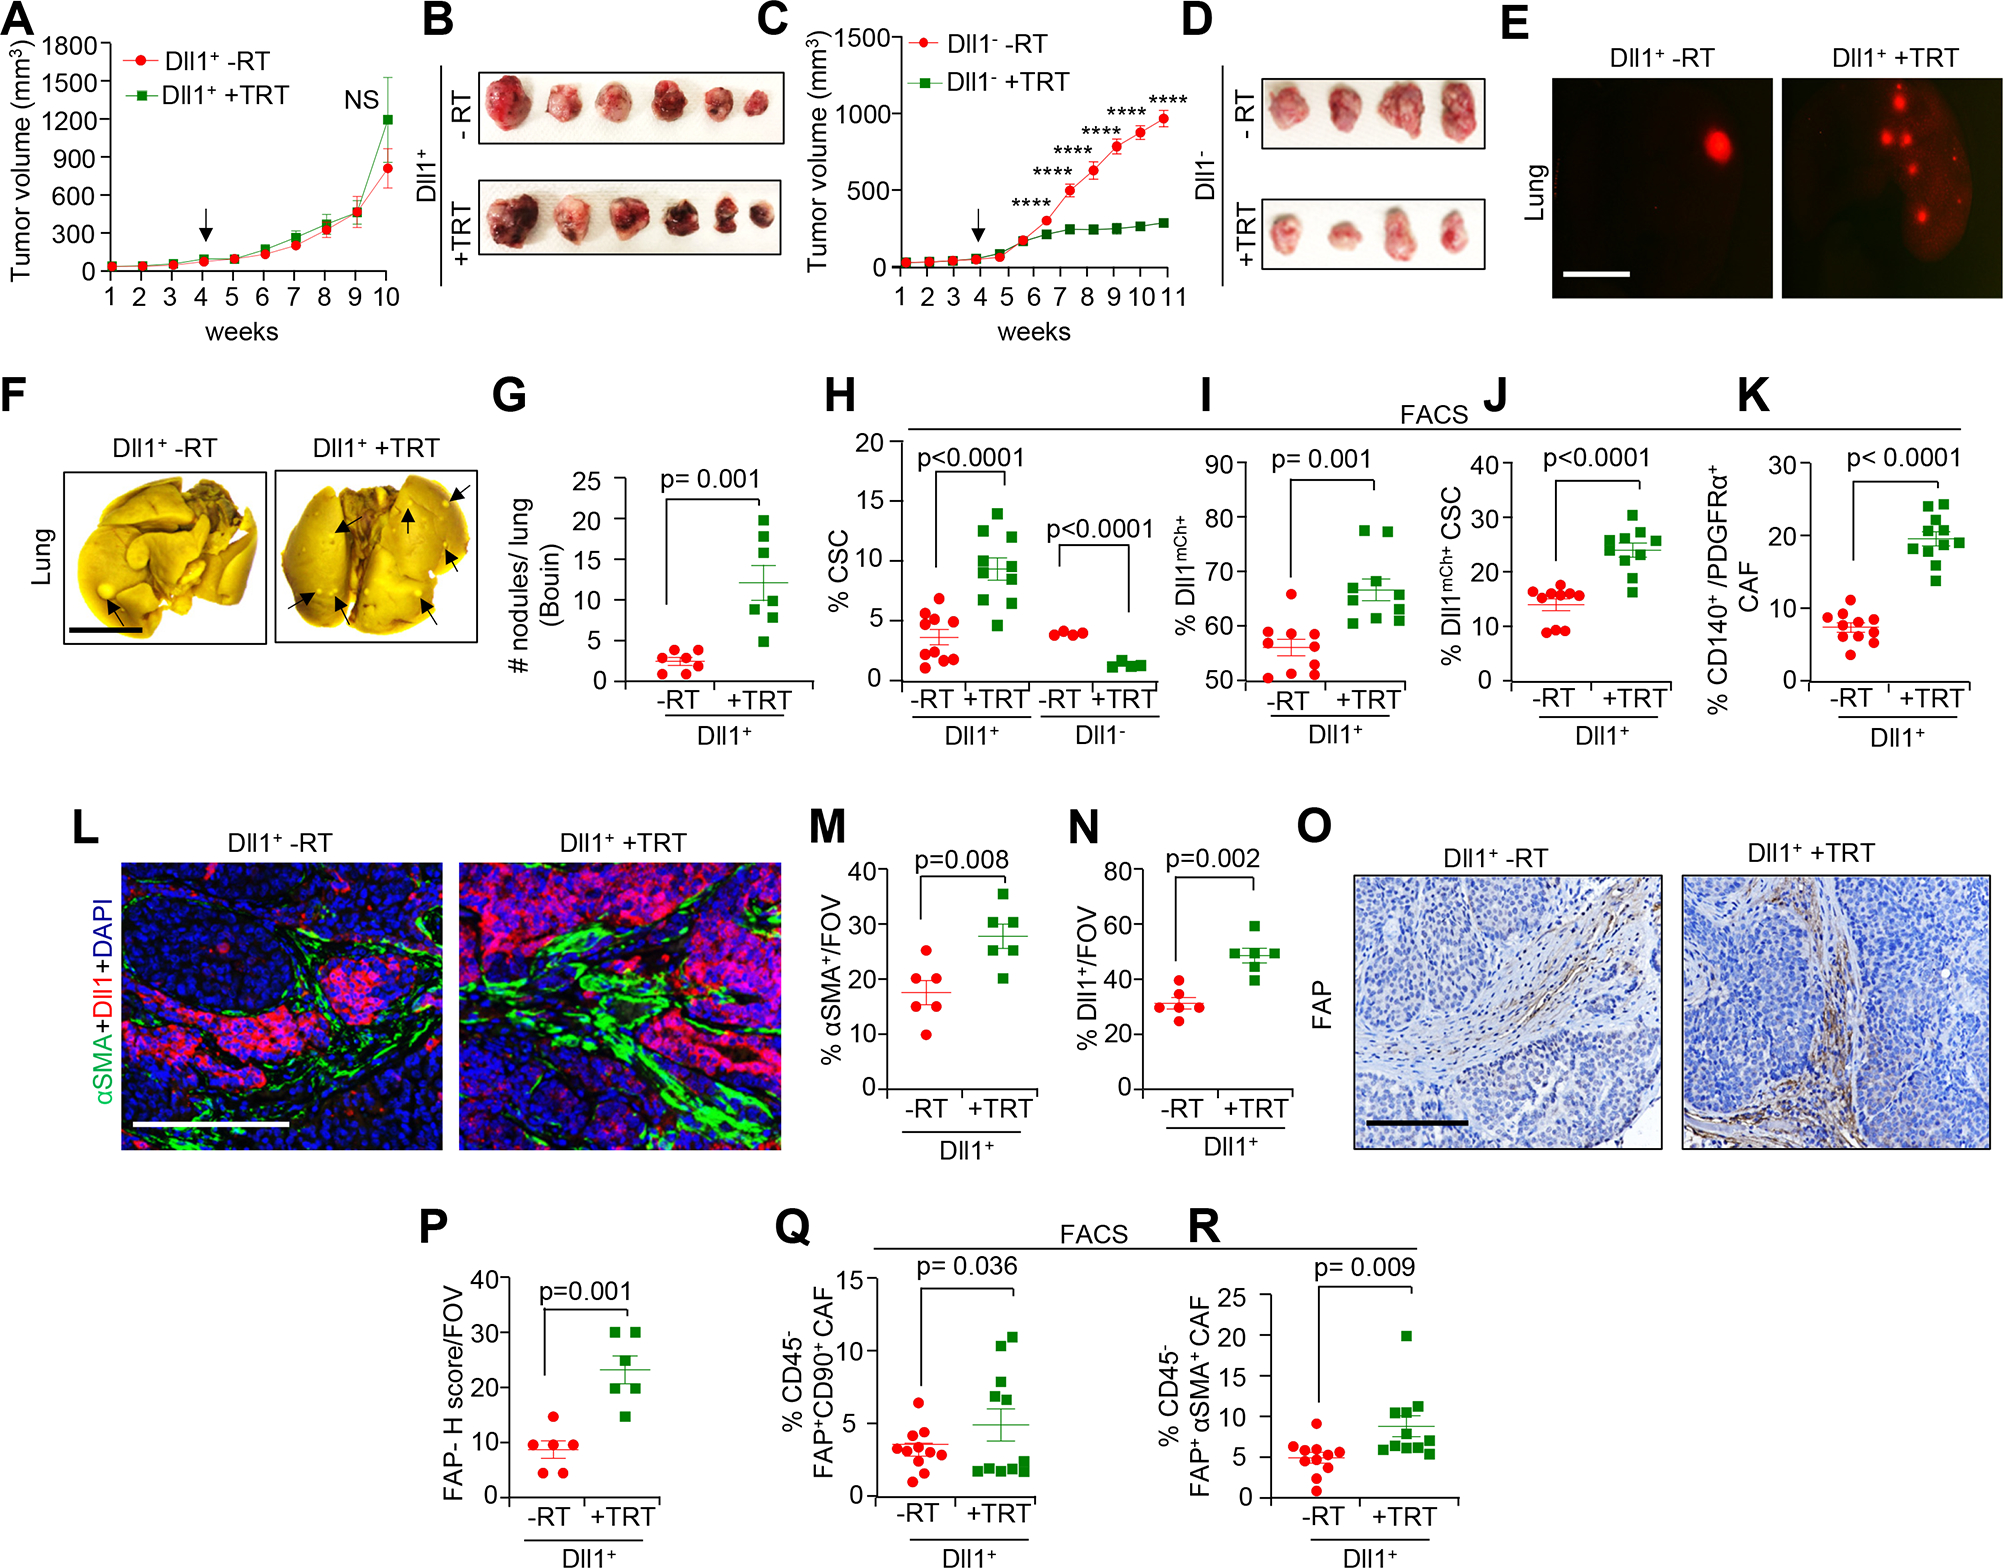
Radiation increases Dll1+ CSCs and CAFs in Dll1+ luminal breast tumors. A total of 80,000 sorted Dll1+ and Dll1− tumor cells from Py-Dll1mCh spontaneous tumors were orthotopically injected into syngeneic C57BL/6 mice. TRT (6 Gy) was given when tumors were established (indicated by black arrow) and tumors (n= 8 tumors/group for Dll1+ tumors, data was combined from two independent experiments) and (n=6 tumors/group for Dll1− tumors) were harvested ~6–7 weeks later. The experiment was repeated twice. A-D, Tumor growth curve and whole tumor images, from Dll1+ tumors (A and B) and Dll1− tumors (C and D) after TRT. E, Fluorescence images showing a greater number Dll1mCh cells in +TRT Dll1+ whole lungs compared to -RT lung. (F and G), Whole lung images post Bouin fixation (F) and quantification (G) showing a greater number of metastatic nodules (indicated by black arrows) in +TRT Dll1+ lungs. Data is combined from two independent experiments (n=7 mice/group). (H-J), Flowcytometry graphs showing increased CSC (CD24−CD44+) population (H), Dll1mCh+ tumor cells (I) and double positive Dll1mCh+ CSC (Dll1mCherry+CD24−CD44+) populations (J) in Dll1+ tumors after TRT. K, Flowcytometry analysis showing an increased CD140+/PDGFRα+ CAF population in +TRT Dll1+ tumors. Data is combined from two independent experiments. (L-N), IF images (L) and scatter plots (M and N) showing increased αSMA+ CAFs and Dll1+ tumor cells in Dll1+ primary tumors after TRT. (O-R), IHC images and quantification (O and P) showing increased abundance of FAP+ CAFs, and Flowcytometry data showing FAP+ CD90+ CAF (CD45−FAP+CD90+) subpopulation (Q) and FAP+ αSMA expressing myCAF subpopulation (CD45−FAP+αSMA+) (R) in +TRT Dll1+ tumors than -RT tumors. Data was combined from two independent experiments. Each dot in the scatter plot (H-K and Q-R) represents an individual tumor. The dots in the scatter plot (M, N and P) represent the field of views (FOVs) from n=4 tumors/group. Data are presented as the mean ± SEM. Two-way ANOVA with Bonferroni post-test (A, C) and unpaired student’s t test (G-K, M-N, P-R) were used to calculate p values. *p < 0.05, ***p < 0.001, ****p < 0.0001. Scale bars, 100 μm (L and O) and 4 mm (E and F).