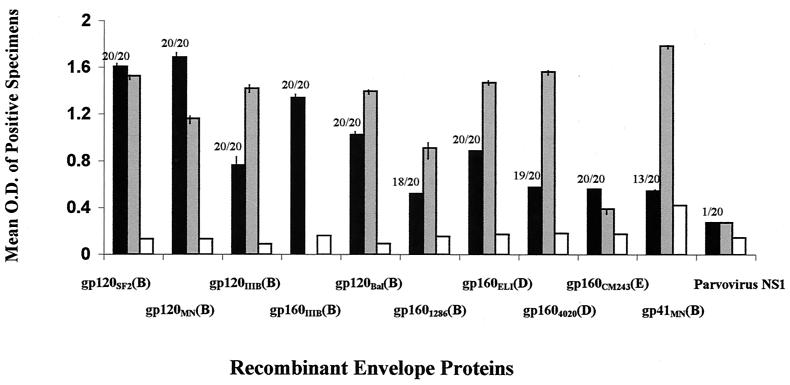
FIG. 2.
Average reactivity of vaccinees' sera with recombinant envelope proteins. The average OD values detected in vaccinees' sera (solid bars) with the designated recombinant proteins are shown on the y axis. Only the results with vaccinees' sera giving reactions above the cut-off were used to calculate the average values. The number of vaccinees' sera (out of 20) giving a positive reaction with a designated protein is shown at the top of each bar. The average OD detected in the three HIV-1-negative control sera (one from a vaccine volunteer who received placebo only, two from HIV-negative participants in the vaccine trials bled prior to their immunization, and two from HIV-negative uninfected unimmunized individuals) with each recombinant protein is also shown (open bars). The average OD detected with all three HIV-positive sera (SX5, SX7, and SX16) (gray bars) is shown. The reactivity with a recombinant protein, NS1, from human parvovirus B19 was used as a negative control. The vertical bars show standard deviations.

